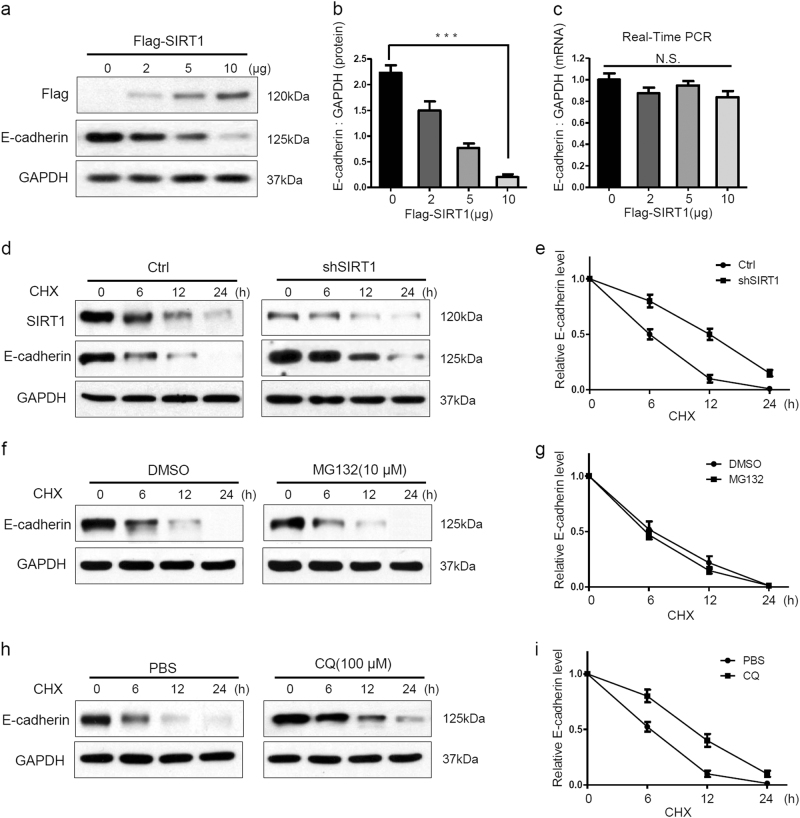
Fig. 3. SIRT1 promotes the lysosomal degradation of E-cadherin.
a–c A375 cells were transfected with the indicated concentrations of Flag-SIRT1 for 24 h. Protein expression were analyzed by western blotting and E-cadherin mRNA expression was analyzed by RT-PCR. d, e A375-shSIRT1 and control cells were treated with CHX (20 μM) for the indicated times, and the protein levels were detected by western blotting. f, g A375 cells were treated with MG132 (10 μM) for 2 h, and then also treated with CHX (20 μM) for the indicated times. The protein levels were detected by western blotting. h, i A375 cells were treated with CQ (100 μM) for 12 h, and then CHX (20 μM) was added for the indicated times. The protein level were detected by western blotting. The bars represent mean ± SE (n = 3). N.S nonsignificant; CHX cycloheximide; CQ chloroquine

