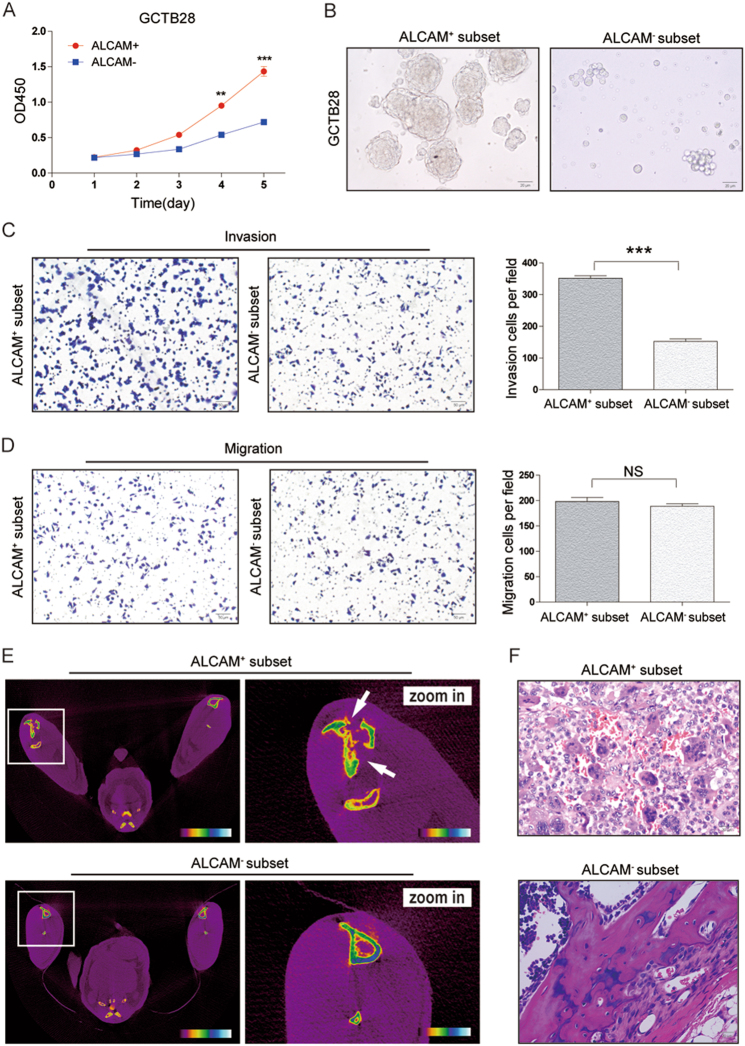
Fig. 3. Characteristics of ALCAM+ subset iIsolated from clinical GCTB samples.
a The proliferative rate of ALCAM+ cells isolated from GCTB28 cells. Data were presented as mean ± s.d. (***p < 0.001; **p < 0.01; *p < 0.05). b ALCAM− cells isolated from GCTB28 cells generated fewer and smaller spheres than ALCAM+ cells after 7 days of serum deprivation and ultralow adherent cell culture. (Scale bar = 20 µm). c, d Compared with ALCAM− cells from GCTB28 cells, ALCAM+ cells exhibited stronger (c) invasive and (d) migratory capacity. Ten high-power fields were selected for comparison. Data were presented as mean ± s.d. (***p < 0.001; **p < 0.01; *p < 0.05). (Scale bar = 50 µm). e, f ALCAM+ cells from GCTB28 cells showed stronger tumorigenic capacity when compared with ALCAM− GCTB28 cells. The ALCAM+ cells were isolated from GCTB28 cells and injected subcutaneously into nude mice using the ALCAM−cells as a control. ALCAM+ and ALCAM− cells with different gradient (500 cells, 1000 cells, 2500 cells and 10000 cells; n = 5 in each gradient) isolated from GCTB28 cells were injected subcutaneously into flank of nude mice. See also Table S3. e Representative images of ALCAM+ and ALCAM− cells-induced tumor formation at 8 weeks after 2.5 × 10³ cells injection. The photo shows a tumor nodule at the site of injected ALCAM+ cells, but not at the site of injected ALCAM− cells. White arrow indicates severe tibia destruction. f Corresponding paraffin-embedded tissue were processed for H&E staining. The histological features of tumor xenograft induced by the ALCAM+ cells are comparable to bone tissue by the ALCAM−cells (Scale bar = 20 µm). Morphology of mice xenograft tissues showed similar pathological features of human GCTB. Green arrow showed multinucleated giant cells

