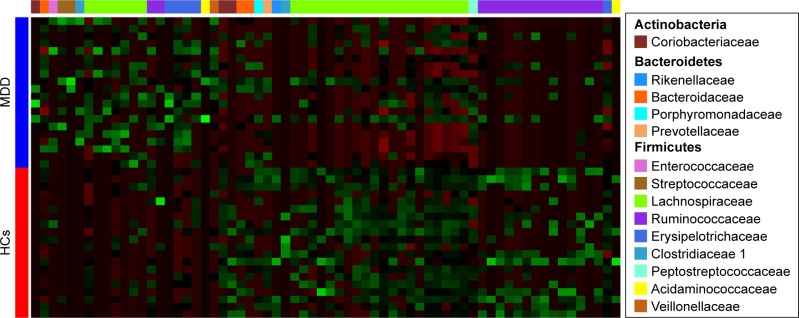
Figure 4.
Heat map of differential operational taxonomic unit abundance between male MDD patients and HCs.
Notes: Assignment of each operational taxonomic unit provided at right. Green and red indicate increase and decrease, respectively.
Abbreviations: MDD, major depressive disorder; HCs, healthy controls.

