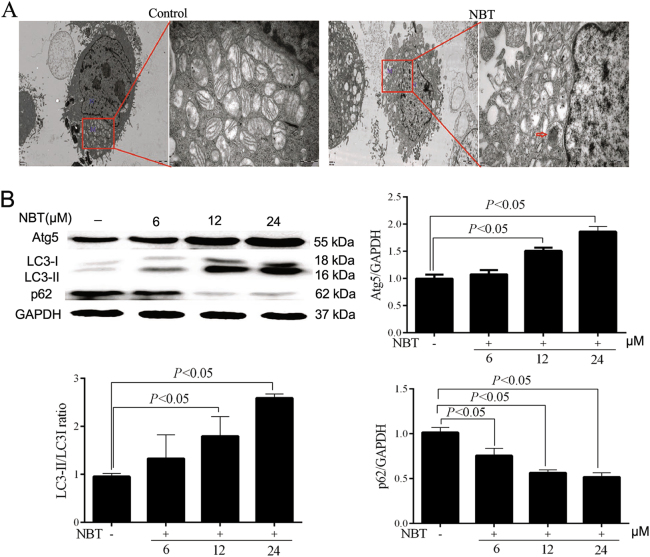
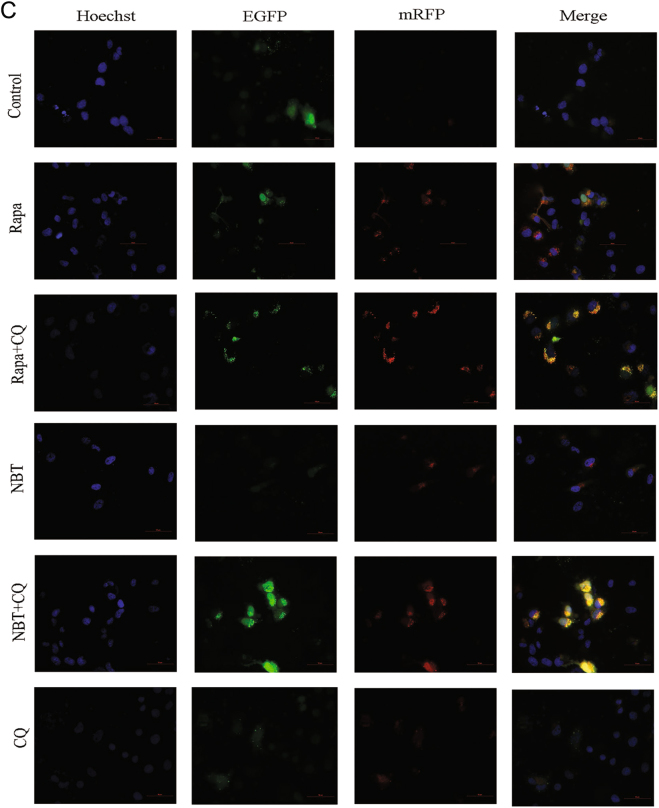
Fig. 5. NBT induced autophagic flux in MCF-7 cells.
a Representative TEM images of MCF-7 cells treated with NBT (12 μM). N nucleus; M mitochondria; red arrows indicate autophagic vacuoles (scale bars: 2 μm, 500 nm). b Total cellular extract of MCF-7 cells treated with 6, 12, and 24 μM NBT was prepared and subjected to Western blot by using antibodies against Atg5, LC3B, and p62. Data represent mean ± SD of three independent experiments. c Cells were transfected with a tandem reporter construct (tfLC3) for 48 h and were exposed to Rapa (0.25 μM), NBT (12 μM), and/or CQ (40 μM) for 24 h. The cells were then stained with Hoechst 33258 fluorescent dye. The puncta were examined by using a fluorescence microscope. Scale bars: 50 μm


