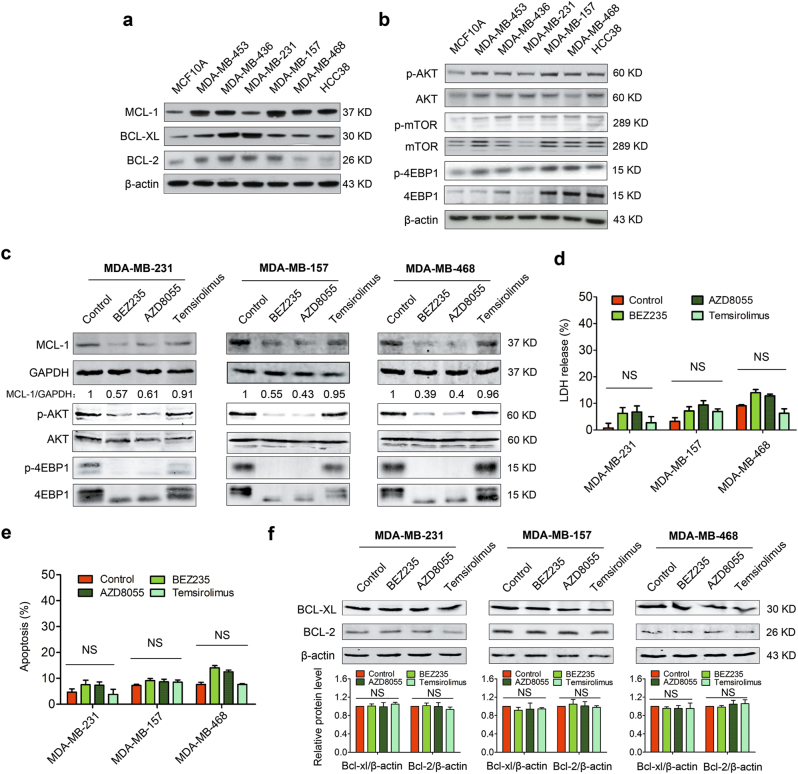
Fig. 1. mTOR inhibitors suppress MCL-1 but fail to induce robust apoptosis in TNBC.
a Immunoblotting analysis for basal line expressions of BCL-2 family pro-survival proteins in a panel of TNBC cell lines and MCF10A. β-actin served as a loading control. b Immunoblotting analysis for basal line expressions of p-AKT, AKT, p-mTOR, mTOR, p-4EBP1 (NB100-81769), and 4EBP1 (NBP1-47366) in TNBC cells and MCF10A. β-actin served as a loading control. c MDA-MB-231, MDA-MB-157, and MDA-MB-468 cells were treated, respectively, with BEZ235 (1 μM), AZD8055 (1 μM), and Temsirolimus (1 μM) for 24 h, then were collected and lysed for immunoblotting analysis using indicated antibodies. d LDH release assays of MDA-MB-231, MDA-MB-157, and MDA-MB-468 cells treated with different mTOR inhibitors (1 μM) as indicated for 24 h. Data represents mean ± SEM of three independent experiments. NS means no significant difference vs. control group. e Quantity analysis of apoptosis induced by different mTOR inhibitors (1 μM) in MDA-MB-231, MDA-MB-157, and MDA-MB-468 cells. Data represent the mean ± SEM of three independent experiments. NS means no significance. f Immunoblotting analysis of expressional changes of BCL-XL and BCL-2 following treating with mTOR inhibitors (1 μM) in MDA-MB-231, MDA-MB-157, and MDA-MB-468 cells. Quantification analysis of the expressions of BCL-XL and BCL-2 is shown in histogram. Data represent the mean ± SEM of three independent experiments. NS means no significant difference.

