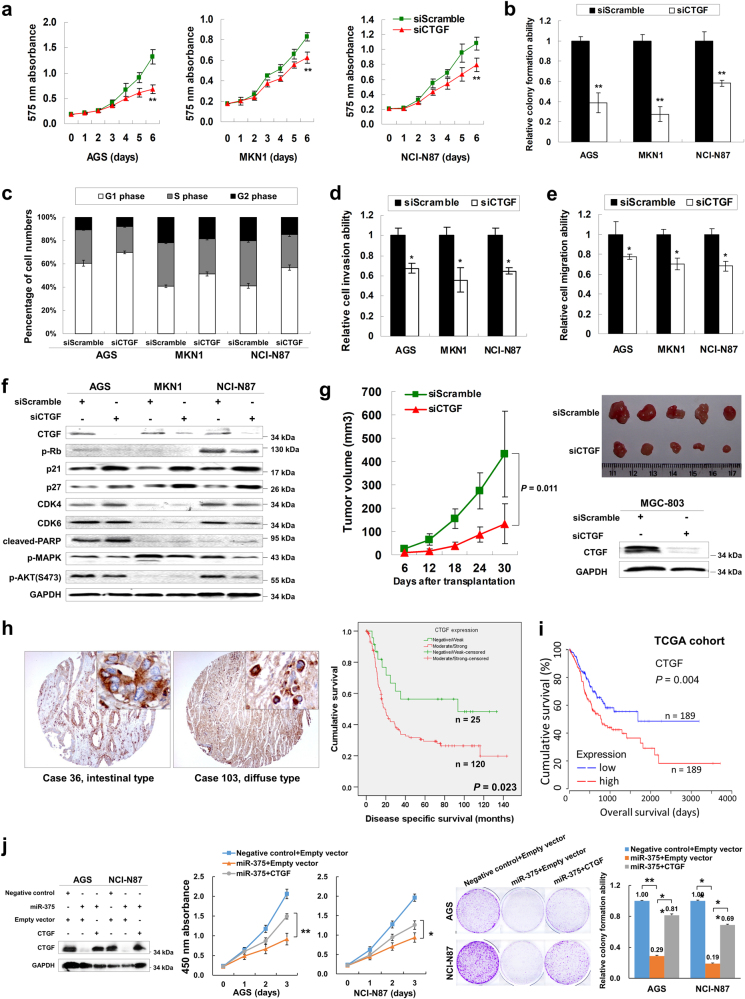
Fig. 6. CTGF knockdown in GC cells phenocopies siYAP1 and miR-375 ectopic expression both in vitro and in vivo.
a MTT proliferation assay revealed that CTGF knockdown by siRNA significantly suppressed proliferation in GC cells (**, P < 0.001). The mean and SDs of the plots were obtained from 6 wells within 3 independent experiments. b Monolayer colony formation assays indicated that CTGF knockdown reduced anchorage-dependent colony formation (**, P < 0.001). The experiments were done three times and the error bars represented SDs. c Flow cytometry analysis revealed the accumulation of cells in G1-phase 24 h after siCTGF treatment. d CTGF knockdown decreased the invasive ability of the GC cells (*, P < 0.05). The cells in 3 random vision fields from 3 independent experiments were counted under the microscope and calculated for getting SDs. e The cell migration ability was significantly inhibited by siCTGF (*, P < 0.05). f Western blot analysis demonstrated p-Rb downregulation, p21/p27 upregulation, cleaved-PARP activation, MAPK and AKT signaling suppression after CTGF knockdown. g siCTGF-MGC-803 formed smaller xenograft tumors than siScramble-MGC-803 in a 30-day in vivo study (P = 0.011). h The representative CTGF IHC pictures in primary samples (Case 36, intestinal type; Case 103, diffuse type; original magnification × 100; insertion × 400). Kaplan–Meier plot of DSS according to CTGF expression indicated moderate/strong CTGF expression correlates with poor survival in gastric adenocarcinoma (right panel, P = 0.023). i High CTGF mRNA expression was associated with poor overall survival in TCGA cohort (P = 0.004). j Western blot analysis and cell functional test of CTGF in the rescue experiments (*, P < 0.05; **, P < 0.001)

