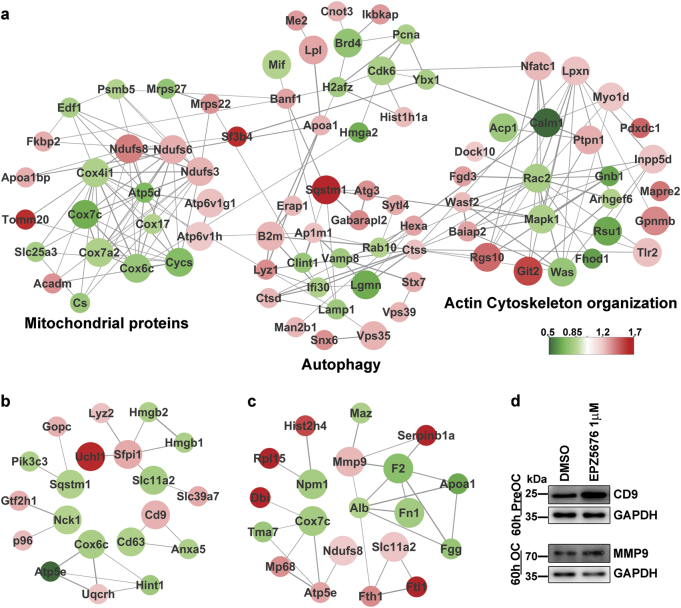
Fig. 6. Interaction network constructed with OC-associated DEPs in three stages of OC formation.
Proteins previously reported to be associated with OC differentiation (indicated by the large circle) and their first connected nodes (indicated by the small circle) were extracted from Fig. S3. The width of the lines connecting the proteins indicates the connection score obtained from the database. Up- or downregulation is indicated by the color of nodes (red, upregulated; green, downregulated). a–c Network of OC-associated DEPs identified in 40-h pre-OCs, 60-h pre-OCs, and 60-h OCs. Function groups were classified on the basis of UniProt function and published reports. Panels a–c share one color ruler. d Verification of upregulation of protein expression by western blotting. Upregulation of CD9 in 60-h pre-OCs and MMP9 in 60-h OCs after DOT1L inhibition was detected in proteomic data and verified by western blotting using specific antibodies. DEPs: differentially expressed proteins

