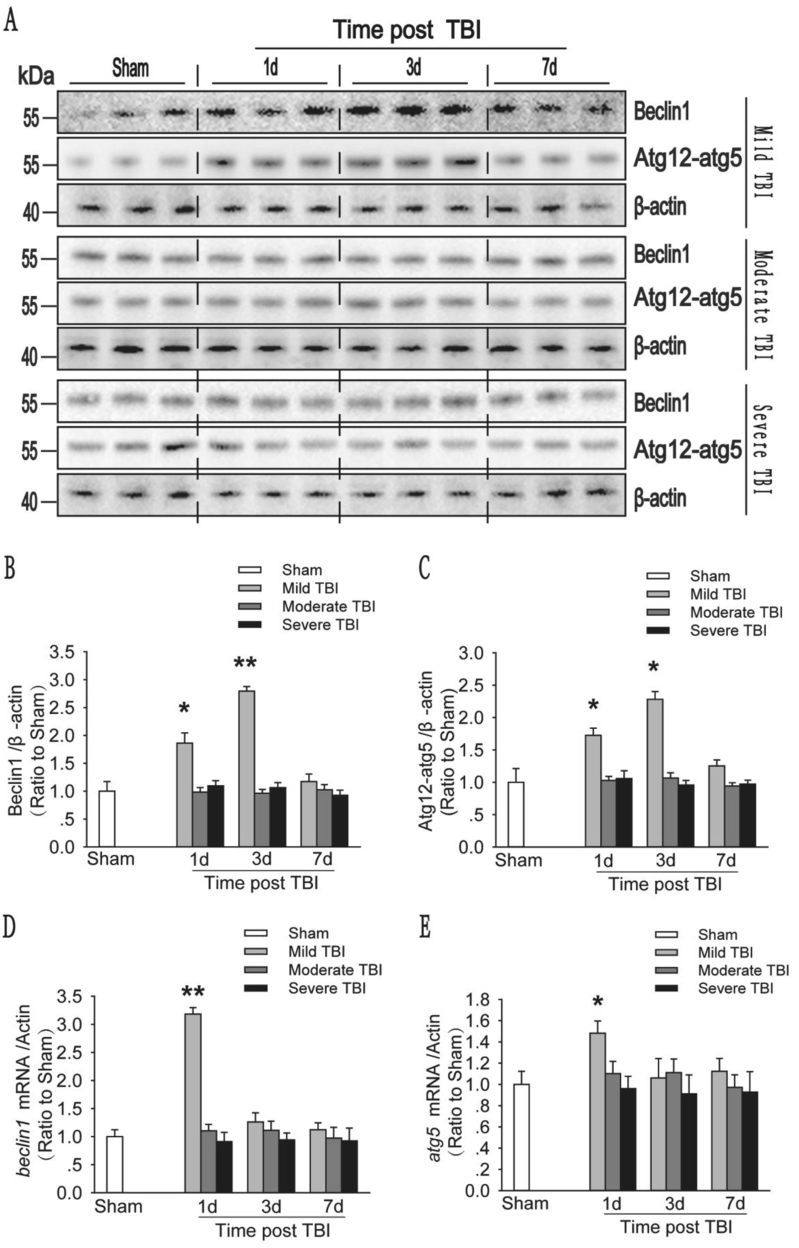
Fig. 2. The initiation of autophagy is increased in response to mild injury, but shows no substantial change in response to moderate and severe injury.
a Western blot analysis of the levels of the autophagy-related protein Beclin1 and the ATG12–ATG5 conjugate. b The Beclin1 levels shown in (a) are quantified and normalized to the β-actin levels. The data are presented as means ± SEM, n = 5–6, *P < 0.05. c The ATG12–ATG5 conjugate levels shown in (a) are quantified and normalized to the β-actin levels. The data are presented as means ± SEM, n = 5–6, *P < 0.05. d Relative mRNA levels (qPCR) of beclin1 in the sham and injured mouse cortex. The results are normalized to β-actin levels. The data shown are presented as means ± SEM, n = 3, **P < 0.01 compared to the sham group. e Relative mRNA levels (qPCR) of atg5 in the sham and injured mouse cortex. The results are normalized to β-actin levels. The data are presented as means ± SEM, n = 3, *P < 0.05 compared to the sham group

