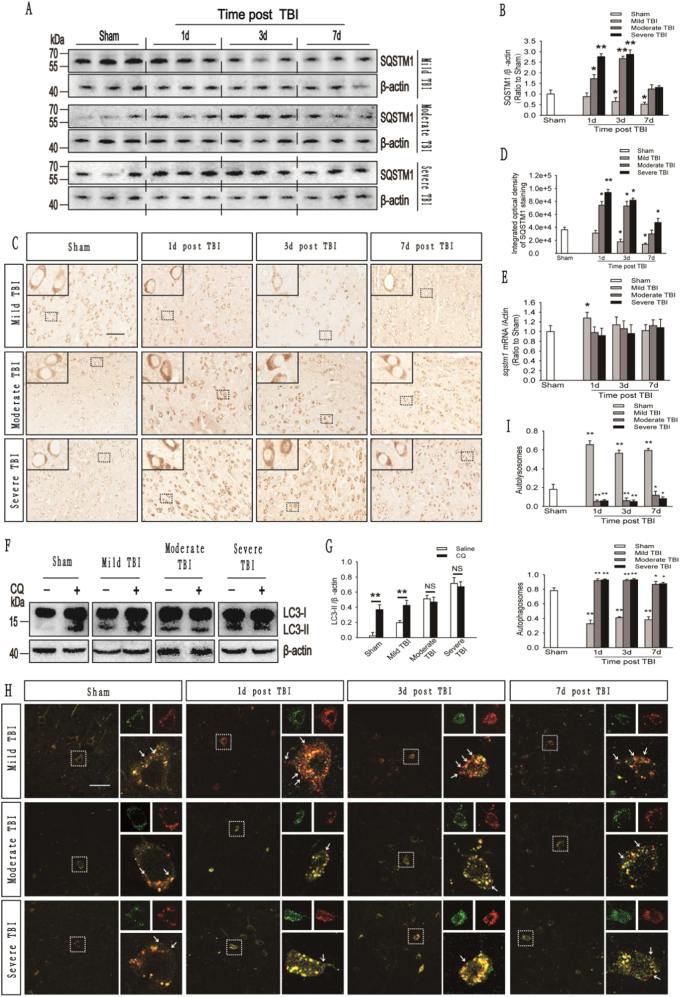
Fig. 3. Autophagic flux is impaired in the cortex after moderate and severe TBI but not mild TBI.
a Western blot analysis of SQSTM1 levels in cortical tissue lysates obtained from sham and TBI mice. b The SQSTM1 levels shown in (a) are quantified and normalized to the β-actin levels. The data are presented as means ± SEM, n = 5–6, *P < 0.05, **P < 0.01. c Images of cortical brain sections obtained from sham and TBI mice stained with antibodies against SQSTM1. Scale bar = 50 μm. d Integrated optical density analysis of the SQSTM1 data are shown in (c). The data are presented as means ± SEM, n = 5–6, *P < 0.05, **P < 0.01 compared to the sham group. e Relative mRNA levels (qPCR) of sqstm1 in sham and TBI mice. The results are normalized to β-actin levels. The data are presented as means ± SEM, n = 3, *P < 0.05 compared to the sham group. f Western blot analysis of LC3 levels in the ipsilateral cortex of CQ-treated mice in the sham and TBI groups. g The LC3-II levels shown in (f) are quantified and normalized to the β-actin levels. The data are presented as means ± SEM, n = 3, **P < 0.01. h Images of cortical brain sections obtained from sham and TBI mice injected with AAV-mRFP-GFP-LC3. Arrows indicate the presence of red puncta. Scale bar = 40 μm. i Quantification of the percentage of autolysosomes (red puncta/total puncta) and autophagosomes (yellow puncta/total puncta) in the images shown in (h). The data are presented as means ± SEM, n = 3, *P < 0.05, **P < 0.01 compared to the sham group. More than 100 cells were quantified for each mouse in each experiment

