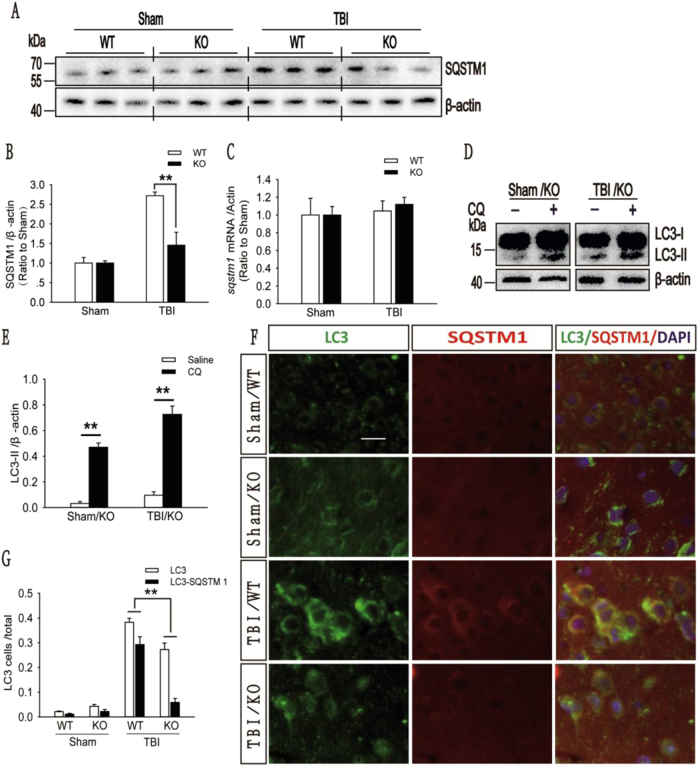
Fig. 7. A2AR KO improved impaired fusion of autophagosomes with lysosomes.
a Western blot analysis of SQSTM1 levels in cortical tissue lysates from the sham and moderate TBI groups of WT and KO mice. b SQSTM1 levels shown in (a) are quantified and normalized to β-actin levels. The data are presented as means ± SEM, n = 5–6, **P < 0.01. c Relative mRNA levels (qPCR) of sqstm1 in sham and TBI mice are normalized to β-actin levels. The data are presented as means ± SEM, n = 3. d Western blot analysis of LC3 levels in the ipsilateral cortex of CQ- or saline-treated KO mice in the sham and moderate TBI groups. e LC3-II levels shown in (d) are quantified and normalized to β-actin levels. The data are presented as means ± SEM, n = 3, **P < 0.01. f Images (×20) of sections of the injured cortex from WT and KO mice in the sham and moderate TBI groups. Sections were stained with antibodies against LC3 and SQSTM1. Scale bar = 10 μm. g Quantification of the numbers of cells that were positive for LC3 alone and for both LC3 and SQSTM1 in the cortical brain sections shown in (f). The data are presented as means ± SEM, n = 3, **P < 0.01 for the comparison between the KO + TBI and WT + TBI groups. More than 1000 cells were quantified for each mouse in each experiment

