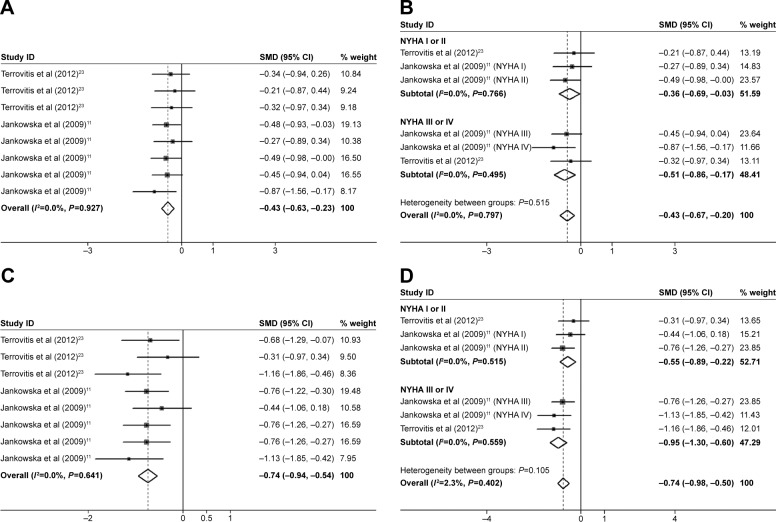
Figure 4.
Forest plots for (A) legs BMD, (B) subgroup analysis of legs BMD by severity of CHF, (C) arms BMD, and (D) subgroup analysis of legs BMD by severity of CHF.
Notes: For each study, the estimate of mean BMD difference and its 95% CI are plotted with a diamond and a horizontal line, respectively. (A and C) Terrovitis et al23 data shown in order of total group, NYHA I or NYHA II group, and NYHA III or IV group, respectively. Jankowska at al data shown in order of total group, NYHA I, NYHA II, NYHA III, and NYHA IV group, respectively.
Abbreviations: BMD, bone mineral density; CHF, chronic heart failure; CI, confidence interval; SMD, standard mean deviation.

