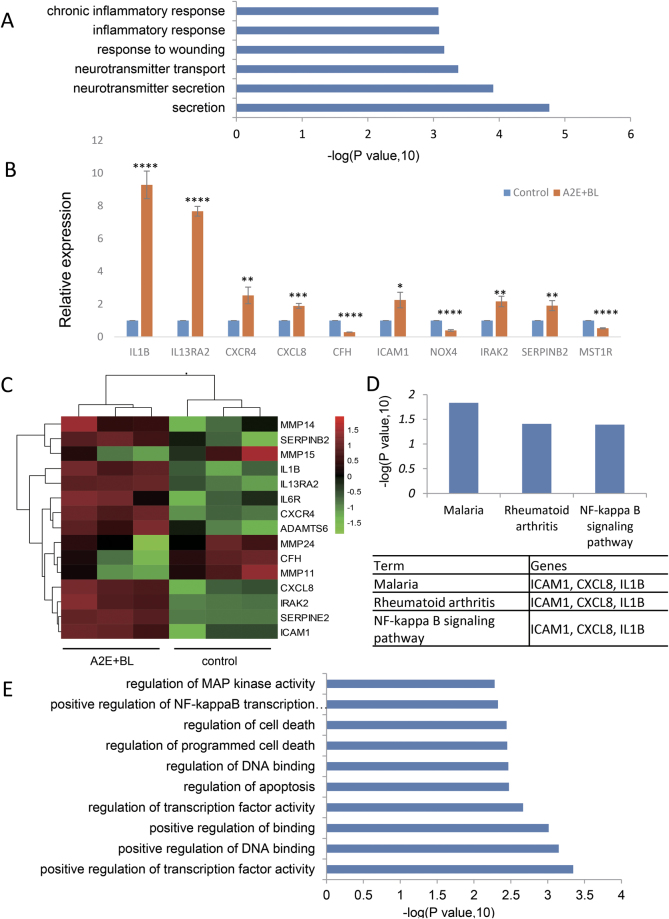
Fig. 4. GO analysis and classification of differentially expressed genes.
a Gene Ontology analysis and classification of differentially expressed genes from control and RPE cells treated with 25 μM A2E under photosensitization into biological processes (top six). b Validation of the expression of the pro-inflammatory genes by RT-qPCR; ** indicates p value < 0.01, *** indicates p value < 0.001, **** indicates p value < 0.0001. The experiment was performed independently at least three times. c Heat map of genes related to SASP. d KEGG pathway analysis of significantly upregulated genes with 25 μM A2E under photosensitization. e Gene Ontology analysis and classification of significantly upregulated genes under 25 μM A2E with photosensitization into biological processes (top 10)

