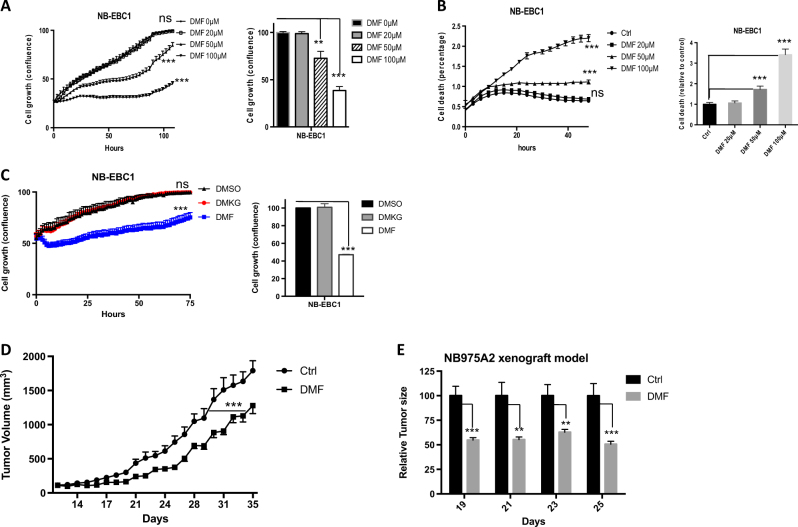
Fig. 3. Dimethyl fumarate suppresses NBL cell growth.
a–c NB-EBC1 cell growth (a and c) and cell death (b) upon indicated treatment were determined by live-cell imaging analysis (IncuCyte ZOOM™) (right panel). The cell confluences or death percentage of control group were set to 100% or 1 in the bar graph (left panel), respectively. Error bars represent standard deviation from the mean of quadruplicate samples. d, e Tumor xenograft was established by using NB975A2 cells and mice were treated daily with 300 mg/kg DMF or vehicle controls. The tumor volumes of control group and DMF-treated group were monitored daily. The tumor volumes of vehicle control group were set to 100%. Error bars represent SEM from the mean of 10 tumors. Data are representative of three independent experiments

