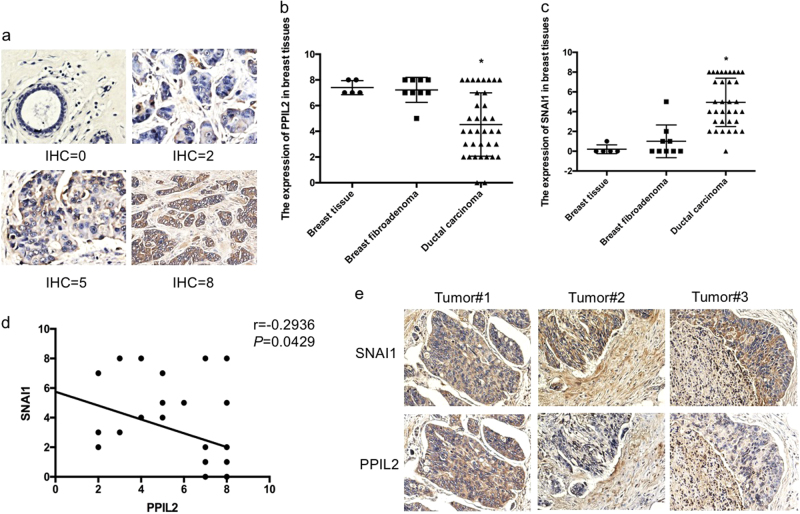
Fig. 7. The expression of PPIL2 in clinical cases.
a A IHC score was assigned to the expression level of PPIL2 and SNAI1 in normal/pericarcinomatous breast tissues (n = 5), breast fibroadenoma tissues (n = 9), and ductal breast cancer tissues (n = 34, 20×). b, c The figures showed that the expression of PPIL2 was significantly less in ductal breast cancer tissues. The expression of SNAI1 was higher in ductal breast cancer tissues than the others. *P < 0.05. d There was a negative correlation between the expression of PPIL2 and SNAI1 level in different breast tissues (r = −0.2936 P = 0.0429). e Lower PPIL2 levels were observed in areas where cancer cells appeared to be traversing the basement membrane to the peripheral tissue (10×)

