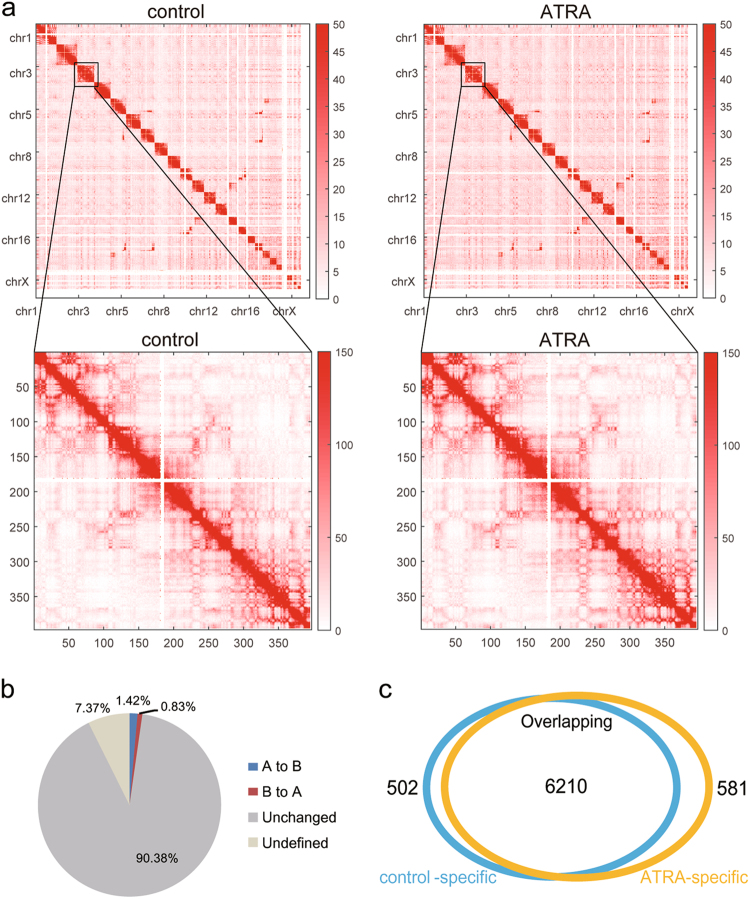
Fig. 1. Chromatin conformation landscapes during ATRA-induced HL-60 differentiation.
a (upper panels) Whole-genome Hi-C heatmaps using 1-Mb bin of control (left) and ATRA-treated (right) HL-60 cells. Chromosomes are stacked from top left to bottom right in order (from chr1 to chrX). (lower panels) Enlarged intra-chromosomal interaction heatmaps of chr3. Color axis is shown on the right. b Pie chart showing the compartment changes between the control and ATRA-treated HL-60 cells. “Unchanged” indicates that the compartments are identical in both cells. “A to B” indicates that the compartments have an A pattern in the control cells and a B pattern in the ATRA-treated cells. “B to A” indicates that the compartments have a B pattern in the control cells and an A pattern in the ATRA-treated cells. “Undefined” indicates regions in which the compartment pattern could not be defined (projection of Hi-C first principal component equals zero). c Venn diagram showing that more than 90% of the TAD boundaries are stable in the control and ATRA-treated cells

