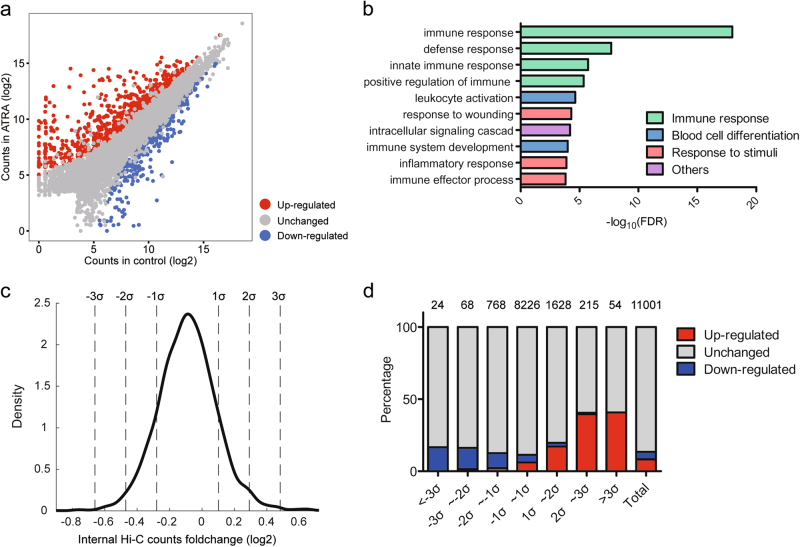
Fig. 2. Distribution of the differentially expressed genes in TADs.
a Scatter plot of the differential gene expression between the control and ATRA-treated HL-60 cells. Red dots denote genes with significantly upregulated expression in the ATRA-treated cells (log2(foldchange)>0.9, adjusted p-value < 0.01). Blue dots denote genes with significantly downregulated expression in the ATRA-treated cells (log2(foldchange)<−0.9, adjusted p-value < 0.01). Gray dots denote genes with no significant expression change. b Top 10 GO terms of differentially expressed genes between the control and ATRA-treated HL-60 cells. FDR false discovery rate. c Probability density of TADs with at least one gene expression change based on the internal Hi-C counts. σ represents the standard deviation of all TAD log2 internal Hi-C counts. d Accumulation bar-plot showing the enrichment of genes in TADs. The TADs are divided into seven categories as shown in Fig. 2c, and total represents all expressed genes located in TADs. Number of genes located in each type of TAD is shown above the bar

