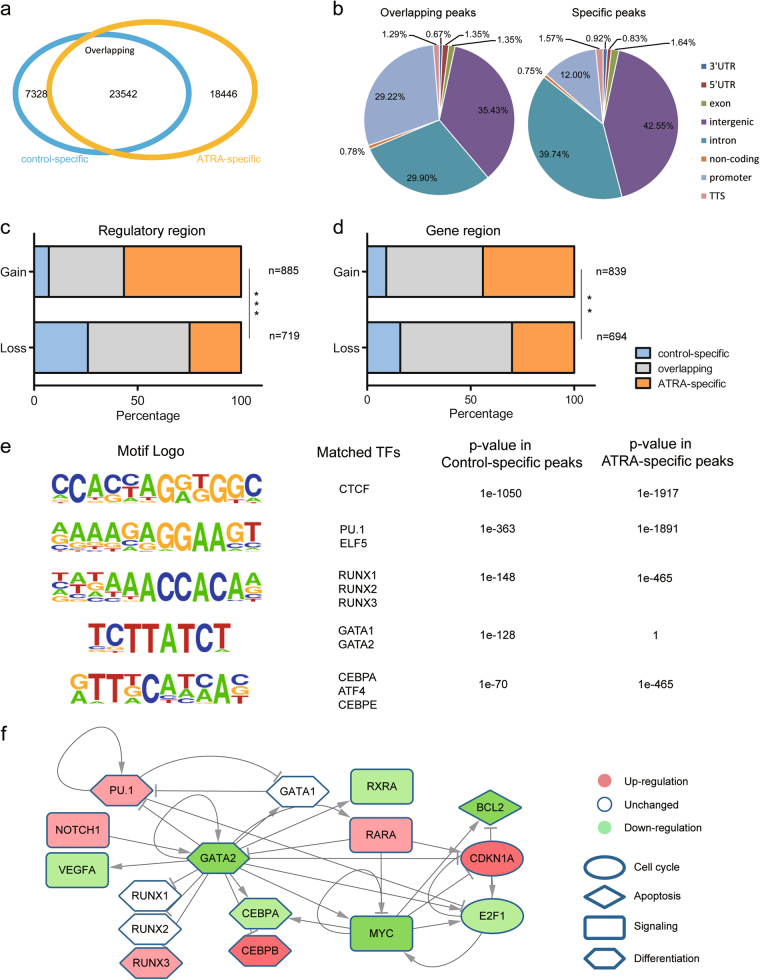
Fig. 4. Changes in chromatin accessibility correlated with gene-regulatory interaction variation.
a Venn diagram showing the ATAC-seq peak overlaps between the control and ATRA-treated HL-60 cells. b Pie chart showing the annotation of the overlapping and specific ATAC-seq peaks. Proportion of promoter peaks is significantly lower in the specific peaks than that in the overlapping peaks. c Accumulation bar-plot showing the enrichment of ATAC-seq peaks in regulatory regions of Gain or Loss interactions. p-Value was determined by Fisher exact test: **p-value < 1e−10, ***p-value < 1e−22. d Similar to Fig. 4c showing enrichment in gene regions. e Homer de novo motif analysis of specific ATAC-seq peaks. Motifs are ordered by significance in the control-specific peaks from top to bottom. GATA motif was only significantly enriched in the control-specific peaks. f Core transcription regulation network of the ATRA-induced differentiation process. Shapes of nodes represent their biological function, including cell cycle (ellipse), apoptosis (diamond), signaling (rectangle), and differentiation (hexagon). Colors of nodes represent expression changes upon ATRA induction, including upregulation (red), downregulation (green), and unchanged (white)

