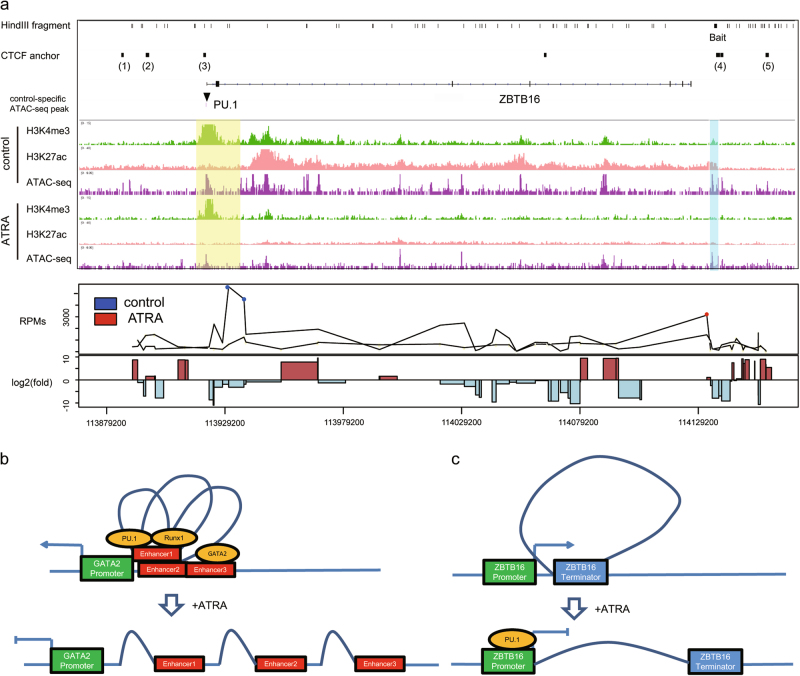
Fig. 6. 5′–3′ loop of ZBTB16 was lost upon ATRA induction.
a Diagram showing ChIP-seq, ATAC-seq and 4C-seq results of ZBTB16. (upper panel) HindIII cutting sites, gene annotation and control-specific ATAC-seq peaks. Transcription factors with enriched motifs in the peak are labeled. (middle panel) Genome browser views of ChIP-seq and ATAC-seq results of ATRA-treated and control HL-60 cells; semitransparent cyan color labels the bait site used in 4C-seq, and semitransparent yellow color labels the site with a strong interaction with the bait recognized in 4C-seq. (lower panel) 4C-seq results of ATRA-treated and control HL-60 cells using the bait mentioned above. Red dots indicate 4C-seq RPMs in the ATRA-treated cells, and blue dots indicate RPMs in the control cells; only fragments with significant interactions with the bait are shown. Log2-foldchange of RPMs are shown in the lowest bar graph. b Model depicting the change in the chromatin architecture around the Gata2 gene. c Model depicting the change in the chromatin architecture around the Zbtb16 gene

