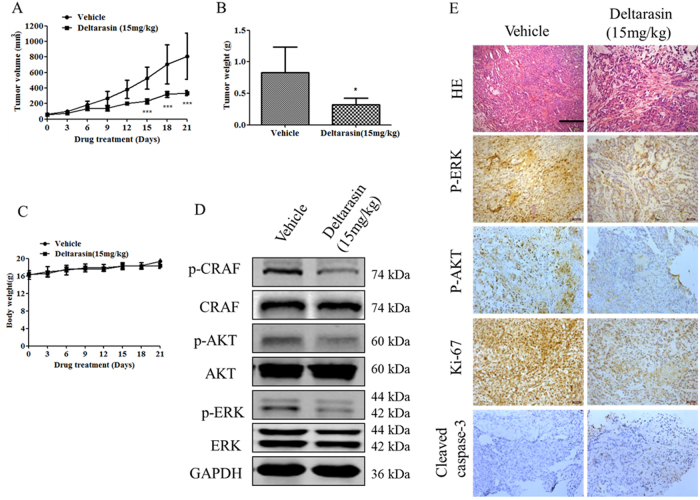
Fig. 3. Tumor suppression effect of deltarasin in A549 xenograft.
. (A) Tumor growth curve was shown with deltarasin i.p. treatment regimen lasting for duration of 21 days. ***P < 0.001 vs. vehicle-treated group. Data represent mean ± SD (n = 5). (B) The average tumor weight of control group and the deltarasin-treated tumor at the day of harvest (day 21). (C) Quantification of body weight mice for each group. Data are presented as mean ± SD; n = 5 per group. (D) Immunoblot analysis of ERK, p-ERK, AKT, p-AKT, CRAF, and p-CRAF in the protein lysates prepared from vehicle-treated tumors and deltarasin-treated tumors. GAPDH was used as a loading control. (E) Images represent hematoxylin & eosin (H&E) and immunohistochemical staining for p-ERK, p-AKT, Ki-67, and cleaved caspase-3 antibody, scale bar, 100 μm

