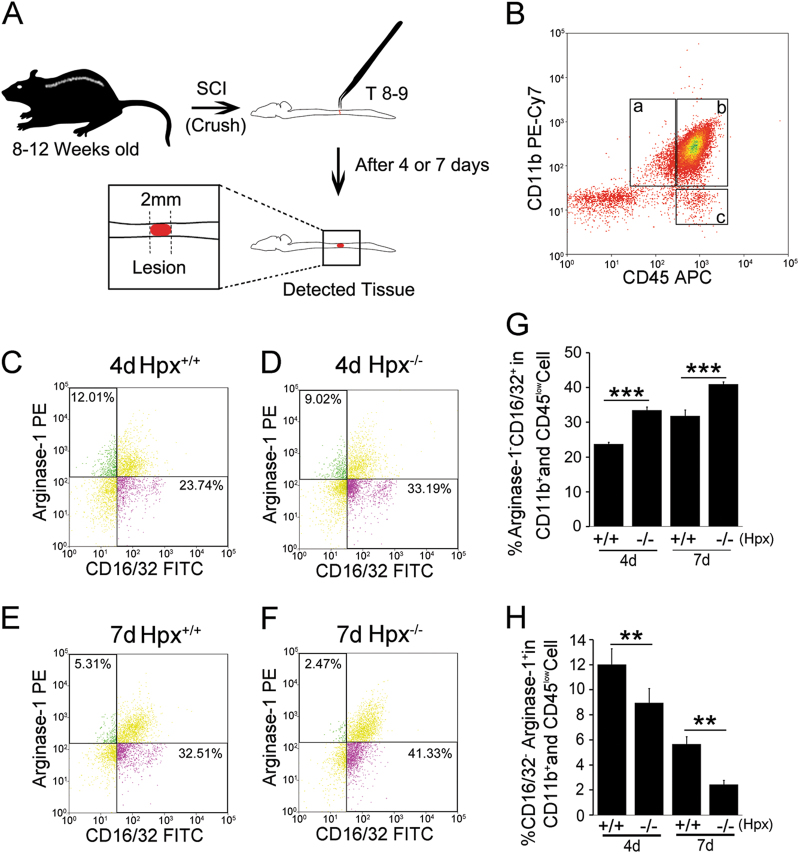
Fig. 2. The percentages of M1 and M2 polarized microglia after spinal cord injury.
a Schematic diagram of the SCI model. The crushed SCI was induced at T8–T9 of the spinal cord in adult mice (8–12 weeks). The indicated tissue was then detected on 4 or 7 dpl. b–f Representative micrographs showing the flow cytometric analysis of microglia isolated from the spinal cords of Hemopexin knockout mice (Hpx−/−) and control mice (Hpx+/+) on 4 or 7 dpl. b Flow cytometric analysis of microglia isolated from the mouse spinal cord. Mononuclear cells were isolated, stained for CD11b and CD45, CD16/32, and Arg-1, and then analyzed using FACS. CD11b+CD45low resting microglia (a), CD11b+CD45hi activated microglia and peripheral macrophages (b), and CD11b+CD45hi lymphocytes (c) are shown. g, h Percentage of M1 (CD16/32+Arg-1−CD11b+CD45low) and M2 (CD16/32−Arg-1+CD11b+CD45low) polarized microglia from the spinal cord of Hpx−/− and Hpx+/+ mice on day 4 or 7 post spinal cord crush lesion. Hpx−/− and Hpx+/+ mice were subjected to a mid-thoracic (T8–T9) laminectomy or SCI. The data are presented as the means ± SEM of three independent experiments, n = 5 per group at each time point. **p < 0.01, ***p < 0.005 compared with the indicated control

