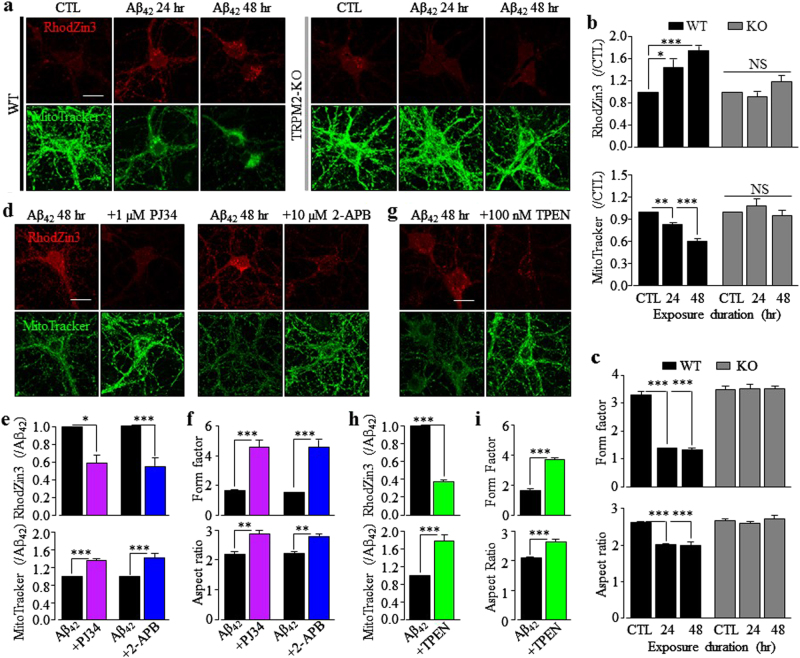
Fig. 3. Aβ42 induces TRPM2-dependent mitochondrial Zn2+ accumulation, loss of mitochondrial function and change in mitochondrial morphology in hippocampal neurons.
a, d, g Representative confocal images showing RhodZin3 (red) and MitoTracker (green) staining of wild-type (WT) and TRPM2-KO neurons under control (CTL) conditions or after exposure to 1 µM Aβ42 for 24 and 48 h a, WT hippocampal neurons after exposure to 1 µM Aβ42 for 48 h with or without treatment with 1 µM PJ34 or 10 µM 2-APB d, or 100 nM TPEN g, 30 min prior to and during exposure to Aβ42. Scale bar is 10 µm. b, e, h Summary of the mean fluorescence intensity of RhodZin3 (top panels) and MitoTracker (bottom panels) under indicated conditions, normalized to that in CTL neurons b or neurons treated with Aβ42 alone e, h. c, f, i Summary of the mean aspect ratio and form factor of mitochondria in neurons under indicated conditions. The data shown in b–c, e–f, h–i were from three to four independent experiments, with each examining 15–20 neurons for each condition. *p < 0.05 and ***p < 0.005 indicate significant difference from CTL b, c or neurons treated with Aβ42 alone (e–f, h–i). NS no significant difference

