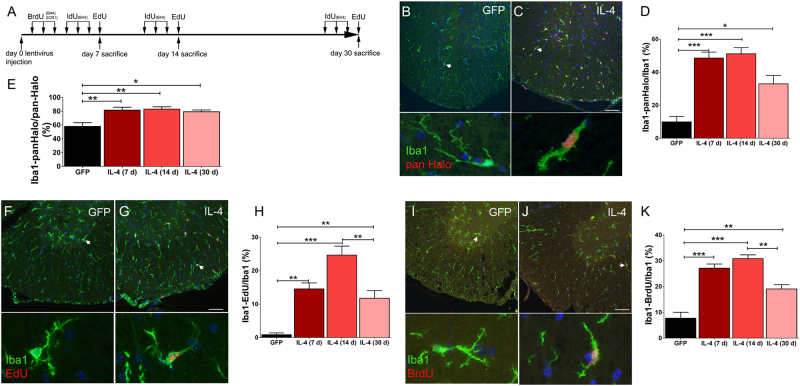
Fig. 2. IL-4 enhances the uptake of S-phase tracers in spinal cord microglia.
a Schematic representation of the S-phase tracers labeling paradigm. b and c Merged images of lumbar sections from GFP-LV and IL-4-LV mice collected at day 14 and double labeled for Iba1 and with the anti-pan Halogen antibody. Arrows indicate cells that are shown at high magnification in bottom panels. d Percentages of Iba1/pan Halogen positive cells among Iba1 cells. Data are represented as mean ± S.E.M. of GFP-LV mice (n = 4), IL-4-LV mice at day 7 (n = 6), IL-4-LV mice at day 14 (n = 5) and IL-4-LV mice at day 30 (n = 3). e Quantification of double positive Iba1/pan Halo cells among pan-Halogen+ cells. Data are represented as mean ± S.E.M. of GFP-LV mice (n = 4), IL-4-LV mice at day 7 (n = 6), IL-4-LV mice at day 14 (n = 5) and IL-4-LV mice at day 30 (n = 3). f and g Merged images showing immunofluorescence for Iba1 and EdU in GFP-LV and IL-4-LV mice at day 14. Arrows indicate cells that are shown at high magnification in bottom panels. h Percentages of double positive Iba1/EdU cells. Data are represented as mean ± S.E.M. of GFP-LV mice (n = 9), IL-4-LV mice at day 7 (n = 4), IL-4-LV mice at day 14 (n = 4) and IL-4-LV mice at day 30 (n = 4). i and j Representative merged images of lumbar spinal cord sections double labeled for Iba1 and BrdU. Arrows indicate cells that are shown at high magnification in bottom panels. k Quantification of double positive Iba1/BrdU cells. Data are represented as mean ± S.E.M. of GFP-LV mice (n = 9), IL-4-LV mice at day 7 (n = 6), IL-4-LV mice at day 14 (n = 5) and IL-4-LV mice at day 30 (n = 3). One-way ANOVA followed by Bonferroni’s multiple Comparison test has been used to analyze plots in panels (d), (e), (h), and (k). *p < 0.05; **p < 0.001; ***p < 0.001. Scale bar 50 µm in (c), (g), and (j); 10 µM in (m) and 30 µM in (p)

