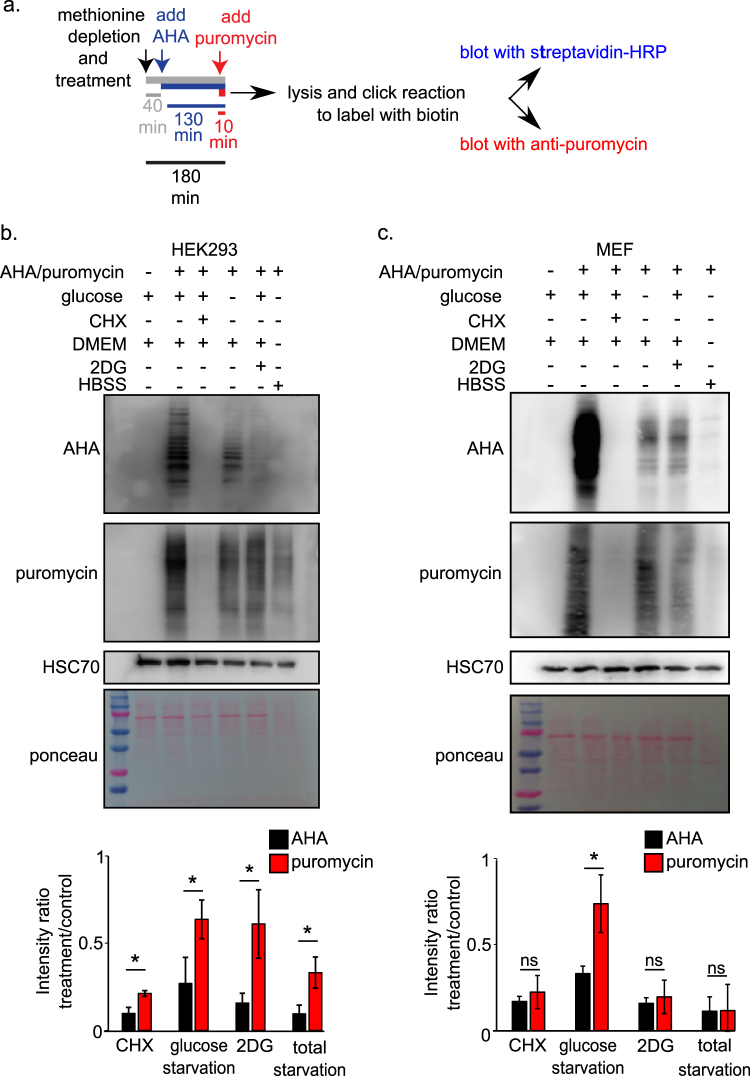
Fig. 1. Measurement of protein synthesis rates in energy-depleted cells to compare AHA and puromycin labeling methods.
a To simultaneously measure mRNA translation under various treatments using the two methods, cells were treated and incubated with AHA and puromycin for the indicated durations. Following cell extraction, AHA-labeled proteins were tagged with biotin by using the Click-It protocol. The incorporation of both AHA and puromycin into newly synthesized proteins was detected by immunoblotting with streptavidin-HRP and with an anti-puromycin antibody, respectively. HSC-70 immunoblotting and Ponceau staining were used as loading controls. Protein synthesis rates were quantified by measuring the signal intensity in each lane using ImageJ and normalizing the values to that of the control lane. b Overall protein synthesis rates in HEK293 cells under the indicated treatments, as measured by AHA and puromycin labeling. Data represents mean ± SD; *p < 0.05; n = 3 independent experiments. c Overall protein synthesis rates in MEFs under the indicated treatments, as measured by AHA and puromycin labeling. Data represents mean ± SD; *p < 0.05; n = 3 independent experiments

