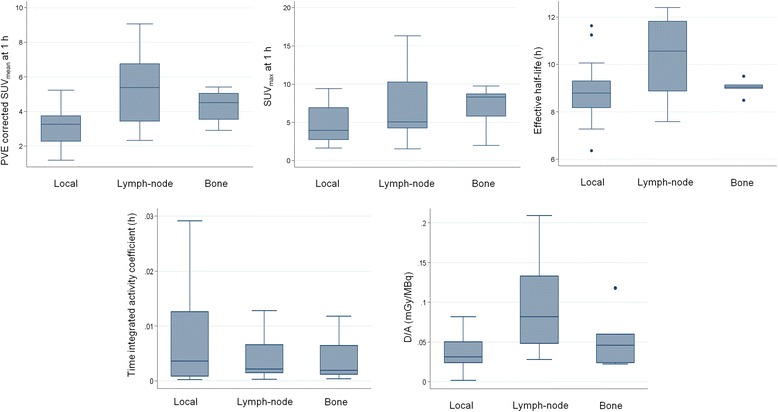
Fig. 3.

Box plot representation of PVE corrected SUVmean and SUVmax values 1 h after tracer injection, the effective half-life, the time-integrated activity coefficient and the absorbed dose (per administrated activity) for the three sites of disease
