
Fig. 2.
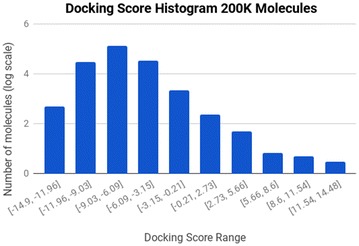
Docking score histogram for 200 K ligands shows an example docking score histogram for a sample of 200 K ligands in log scale. The data distribution is skewed right because we have fewer molecules with high scores, which is normal for these types of datasets as only a few ligands have a good fit with the target protein and the majority will not bind with high affinity