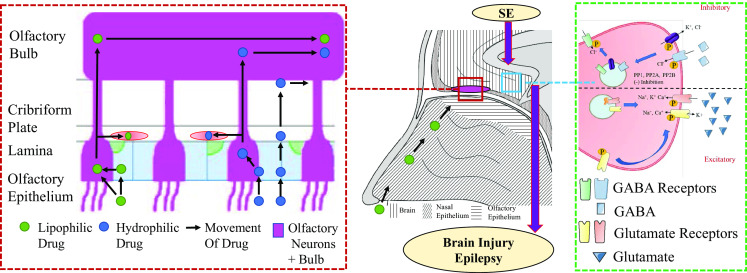
Fig. 1.

Left path of drugs through the olfactory structures; middle coronal diagram of the nasal cavity and brain; right changes in synaptic channel expression due to SE. GABA γ-aminobutyric acid, KCC2 potassium chloride cotransporter 2, PP protein phosphatase, SE status epilepticus. Representative sagittal section of the nasal cavity and forebrain showing dynamic passage of different type of drugs through the olfactory cavity(Red dash box) and its potential modulation of main receptor activation in status epilepticus (Green dash box)
