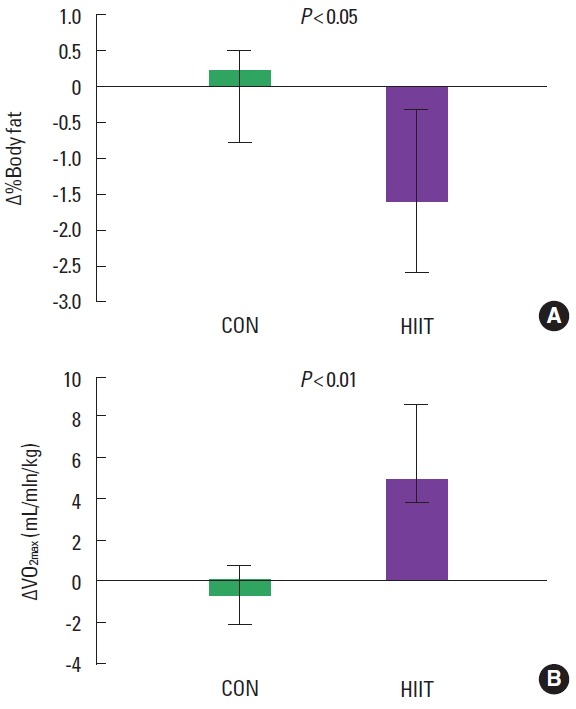
Fig. 1.

Delta variation differences between T0 and T1 for the control and HIIT for body fat % (A) and maximum oxygen uptake (VO2max) (B). CON, control group; HIIT, intervention group.

Delta variation differences between T0 and T1 for the control and HIIT for body fat % (A) and maximum oxygen uptake (VO2max) (B). CON, control group; HIIT, intervention group.