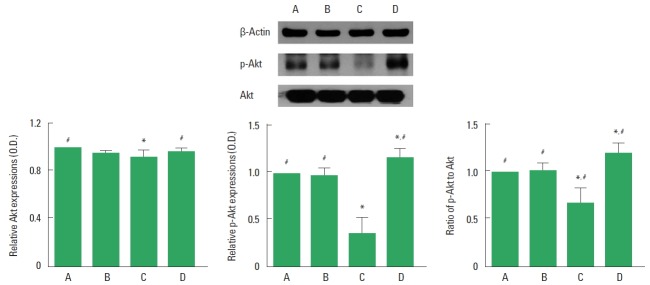
Fig. 2.
Effect of treadmill exercise on protein kinase B (Akt) and phosphorylated Akt (p-Akt) expression in the hippocampus. Upper panel: representative expression of Akt, p-Akt, and β-actin. Lower panel: relative expression of Akt, p-Akt, and p-Akt/Akt ratio. Left panel: relative Akt expression. Middle panel: relative p-Akt expression. Right panel: relative ratio of p-Akt/Akt. The data are represented as the mean±standard error of the mean. A, control group; B, exercise group; C, social isolation group; D, social isolation and exercise group. *P<0.05 compared to the control group. #P<0.05 compared to the social isolation group.

