
Figure 7. DQ661 improves survival in colon cancer model and potentiates activity of gemcitabine in KPC pancreatic cancer syngeneic model.
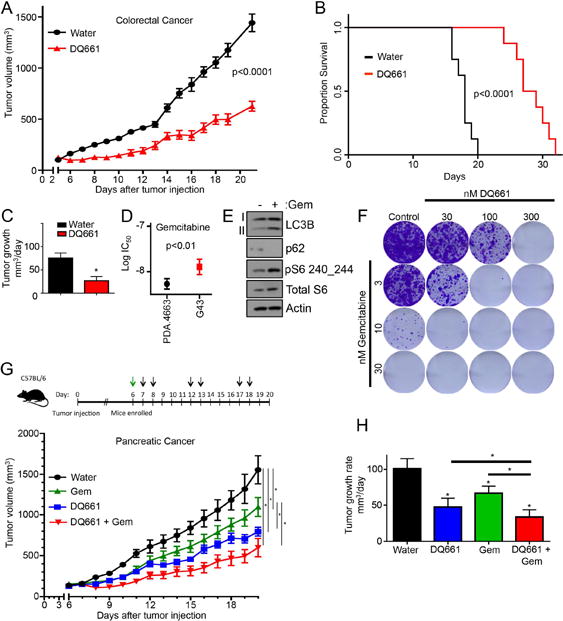
(A) HT-29 cells were injected s.c. into the flanks of NSG-mice and grown until tumor were palpable. Mice (n=8/arm) were treated with water or DQ661 (4 mg/kg) i.p. DQ661 treated mice were treated 2 days on, 2 days off. Mean +/− SEM is presented. (B) Survival curve for (A) displaying the time it took for mice to reach death (defined as time when tumor volume exceeded 1000mm3). (C) A linear mixed-effect model was used to test the difference of the tumor growth trends among treatment groups (A) Mean +/− SEM tumor growth rate. (D) MTT assay of KPC cell lines 4662 and G43 treated with gemcitabine (72 hr, 3 – 30 nM). *p<0.05. (E) G43 cells were treated with gemcitabine (24 hr, 10 nM) and lysate was immunoblotted. (F) G43 cells were treated chronically for 2 weeks with gemcitabine (3 – 30 nM) in the presence or absence of DQ661 in colony formation assays. Cells were stained with crystal violet and imaged. (G) G43 cells were injected subcutaneously into the flanks of C57BL/6 mice (2 × 10⁶ cells/mouse. Once palpable, mice (n=8 mice per treatment arm) were treated with vehicle (PBS), gemcitabine (120 mg/kg, i.p.), DQ661 (4 mg/kg, i.p., 2 days on, 3 days off) or a combination of gemcitabine and DQ661. (H) A linear mixed-effect model was used to test the difference of the tumor growth trends among treatment groups (D) Mean +/− SEM tumor growth rate.