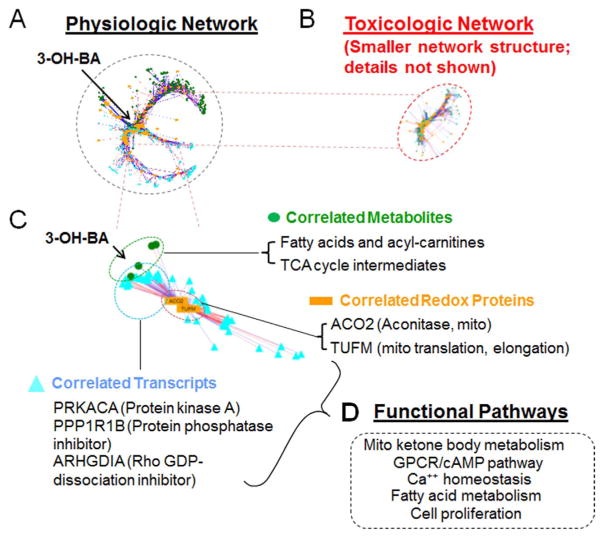
Fig. 6.
Integrated Redox Proteome-Metabolome-Transcriptome analysis of physiologic variation in Mn concentration in SH-SY5Y cells. A. xMWAS analysis (sparse partial least squares; sPLS, r ≥ 0.6) of redox proteome, metabolome and transcriptome correlations as a function of added Mn 0–10 μM, 5 h). B. xMWAS as in A with toxicologic Mn 50–100 μM, 5 h). Note that the network size is much smaller and includes far fewer elements. C. Expanded view of metabolites, transcripts and redox-sensitive proteins changing in association with central mitochondrial metabolite, 3-hydroxybutyric acid (3-OH-BA). Correlated mitochondrial metabolites included tricarboxylic acid cycle intermediates, fatty acids and acyl carnitines. Correlated redox proteins included mitochondrial aconitase and mitochondrial translation elongation factor, TUFM. Correlated transcripts included regulatory kinase and phosphatase. D. Pathway mapping using Kyoto Encyclopedia of Genes and Genomes (KEGG) showed associations of central clusters with functional pathways.

