
Figure 3.
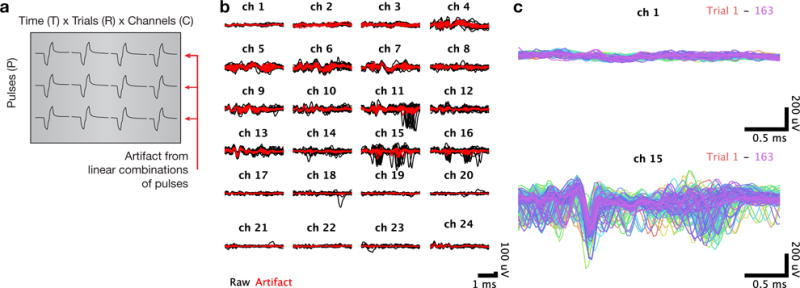
The second stage of artifact removal removes common artifact structure across the successive pulses of the stimulus train. (a) To isolate structure across pulses, we rearrange the artifact data into individual matrices for each channel, each with dimensions time (T) × trials (R) × channels (C) by pulses (P). (b) Voltage recordings for a single trial, plotted separately for each channel with the responses to each pulse superimposed. Raw voltage recordings are shown in black, with the artifact inferred via principal components regression shown in red. (c) Cleaned voltage recordings for a single pulse with the responses to all trials superimposed. The top panel shows a superficial channel which had no detectable spontaneous neural activity, and the bottom panel shows a lower channel where a well-isolated single unit was spiking spontaneously.