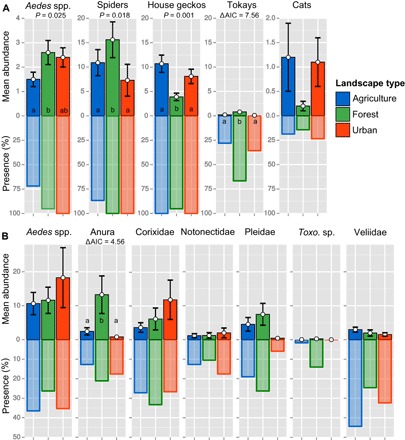
Fig. 3. Mean abundance ± SE and % presence of terrestrial and aquatic taxa in or near buildings in three landscape classes.

Green bars display forest landscapes, which were those areas in which forest (canopy cover > 30%) constituted 30% or more of the study area. Red bars are urban landscapes (urban areas constitute 25% or more of the landscape), and all other areas are considered agricultural landscapes (blue bars). The sample size (n) for the terrestrial species (A) in agriculture, forest, and urban landscapes was 32, 21, and 17, respectively; for aquatic species (B), this was 63, 57, and 34. Mean abundance of Aedes, house geckos, and spiders was compared using linear models (significant P values are given in the figure) and Tukey’s post hoc test (groups are noted with letters). For other taxa, we used zero-inflated negative binomial models. When AIC values were more than two points higher than the null model, the habitat effect was considered significant and Tukey’s post hoc test was then used on the count and zero-inflated models. Aedes spp. abundance is given as trapped mosquitoes per 24 hours, for spiders, geckos, and tokays; this is the number of individuals per 100-m2 wall, and for cats, this is the number per household. Abundance of aquatic taxa is given as individuals per water-filled container-like habitats.
