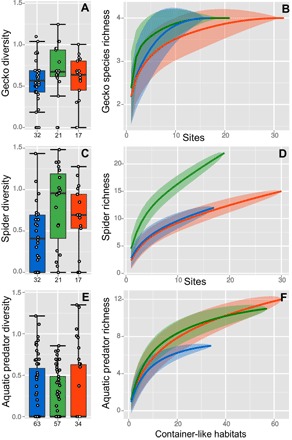
Fig. 4. Predator taxon diversity and richness for the three main predator groups in different landscape types.

In the boxplots, the horizontal bar gives the median, the box gives the interquartile ranges, the whiskers give the largest and lowest values with a maximum extent of 1.5 times the interquartile range, and the values on the x axis show the sample size (n). Diversity is given as Hill numbers (the exponential of Shannon’s entropy index). Predator richness is given as rarefied curves, which show the increase in recorded taxa with increasing number of observed individuals. Confidence intervals were calculated following Chao’s bootstrap method (30). Curves that are leveling off indicate that predator richness was estimated well by the sampling. When curves do not level off, it is expected that more taxa would have been detected with greater sample sizes. (A) Gecko species diversity on buildings in agricultural (yellow), forest (green), and urban (red) landscapes. (B) Rarefied gecko species richness curves, (C) spider family diversity, (D) rarefied spider family richness curves, (E) aquatic predator diversity (including invertebrate families, Anura, and fish), and (F) rarefied aquatic predator richness curves.
