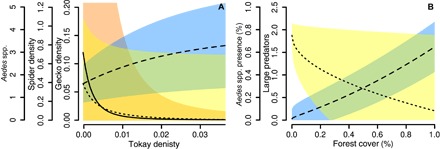
Fig. 5. Predicted values based on structural equation models.

In (A), the change in species abundance as an effect of changes in tokay density is given (individuals per 100 m2). Aedes spp. abundance (trapped individuals per 24 hours) is shown in yellow with a small dashed line, spider density (individuals per 100 m2) is shown in blue with a large dashed line, and gecko density (individuals per 100 m2) is shown in red with a solid line. In (B), the change in species abundance is shown as an effect of change in forest cover. The probability of Aedes spp. presence is shown in yellow with a small dashed line, and the total abundance of large predators is given in blue with a large dashed line. Solid colors represent 95% confidence intervals.
