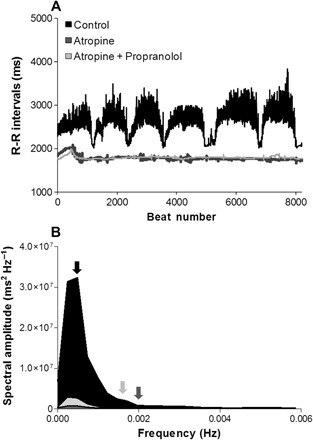
Fig. 3. Tachogram of RRi and power spectral density L. paradoxa at 25°C.

(A) A tachogram plot of 8192 consecutive RRi from a single L. paradoxa (260 g) in untreated condition before drug injection (black trace) and following autonomic blockade with atropine (dark gray trace) and atropine + propranolol (gray trace). (B) Average spectral amplitude density from lungfish in an untreated condition (Control: before drug injection, 48 hours after surgery; n = 8, black area), after cholinergic receptor blockade (Atropine; n = 6, small dark gray area), and after total blockade of β-adrenergic and cholinergic receptors (Atropine + Propranolol; n = 6, small gray area). The mean breathing frequency (fR) of the Control (fR, ~1.7 breaths hour−1), Atropine (fR, ~7.3 breaths hour−1), and Atropine + Propranolol (fR, ~5.9 breaths hour−1) groups are represented by black, dark gray, and gray arrows, respectively.
