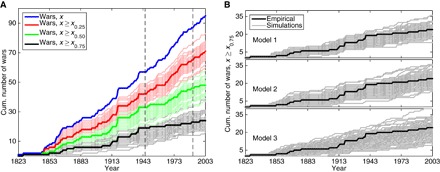
Fig. 4. Cumulative counts of wars by general severity.

(A) Empirical counts of wars of different sizes (dark lines) over time against ensembles of simulated counts from a stationary model, in which empirical severities are replaced iid with a bootstrap draw from the empirical severity distribution (model 1). For reference, dashed lines mark the end of the Second World War and the end of the Cold War. (B) For the largest-severity wars alone, empirical and simulated counts for three models of stationarity, which incorporate progressively more variability in the underlying data-generating process (see main text).
