
Fig. 4. The oxidized and reduced forms of the A2 domain have different dynamics and stresses.
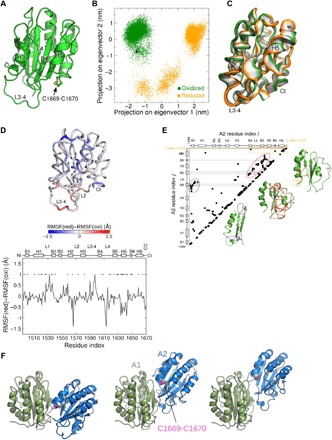
(A) Overall structure of the VWF A2 domain (from the x-ray structure, PDB identifier 3GXB) used as starting conformation for the MD simulations. The structure is shown in cartoon representation, highlighting the Cys1669-Cys1670 disulfide bond in yellow. (B) Dynamics of the oxidized (green) and reduced (orange) VWF A2 domain projected onto the first two eigenvectors (main modes of motion) obtained from principal components analysis (PCA). Each dot represents a conformation observed in the MD simulations. The black dot corresponds to the starting structure for both simulations. (C) Interpolation of the structures along the first PCA eigenvector (main mode of motion), ranging from the conformations sampled in the oxidized state (green) to the reduced state (orange) (going from the extreme left to the extreme right). Ct, C-terminal. (D) Per-residue difference of the root mean square fluctuations (RMSFs) between the reduced (red) and oxidized (oxi) forms of VWF A2. Statistically significant differences are highlighted with the * symbol. The secondary structure of the protein is presented on top. Nt, N-terminal. (E) Force distribution analysis (FDA). (Left) Residue pairs (i,j) with the time-averaged pairwise force of the reduced state minus that of the oxidized state larger than a cutoff value of 90 pN, |〈Fij(red)〉 − 〈Fij(oxi)〉| > 90 pN. Here, | | indicates absolute values. For the dependence on the cutoff value, see fig. S2. Secondary-structure elements of A2 are shown on both axes. To guide the eye, the regions corresponding to the β strands B4, B5, and B6 are shown in gray and the region corresponding to the Cys1669-Cys1670 bond is shown in orange. (Right) The three groups of residue pairs enclosed by circles, showing interactions between the β strands and their surrounding helices, loops, or the C terminus, are explicitly shown as lines connecting points in the A2 structure. (F) The three most favorable structural models of the VWF A1A2 complex predicted by molecular docking and MD simulations (13). A1 (green) and A2 (blue) domains are shown in cartoon representation. The Cys1669-Cys1670 bond (magenta and yellow) is shown in ball-stick representation.