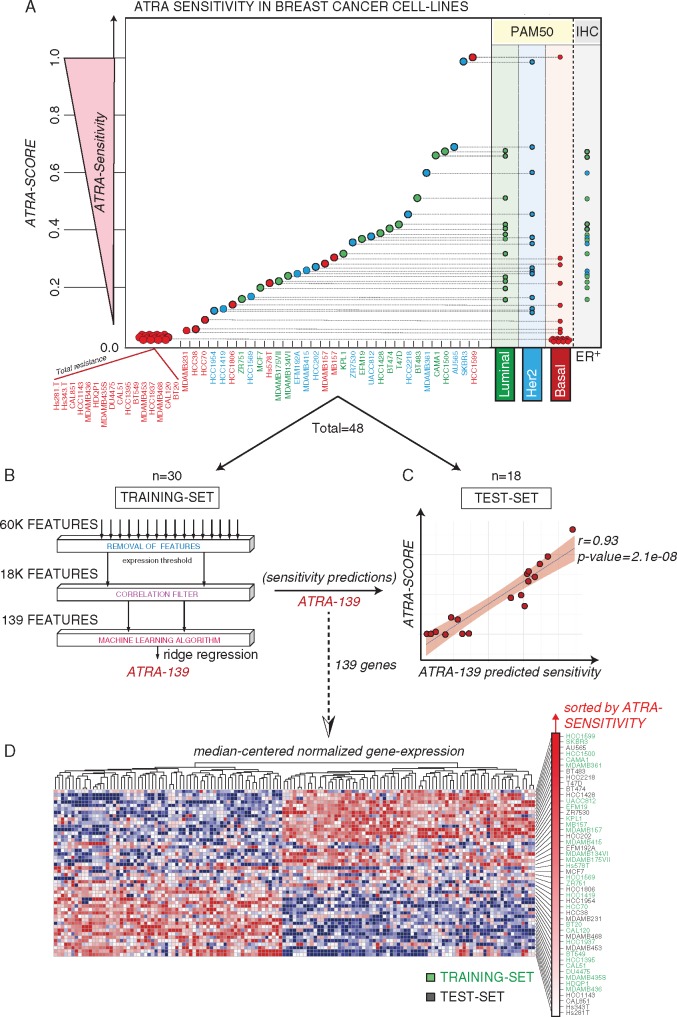
Figure 1.
ATRA sensitivity profiles in breast cancer cell-lines and ATRA-139 model. (A) The indicated breast cancer cell-lines were treated for 9 days with increasing concentrations of ATRA and the corresponding ATRA-sensitivity scores (ATRA-Scores) were calculated. The PAM50 classification and ER-positivity of the cell-lines are indicated on the right. (B) The workflow adopted in the selection of the features used for the training of the ridge regression model is shown. Total = 48 cell-lines; Training-set = 30 cell-lines; (C) The scatter plot shows the performance of the ATRA-139 model in predicting ATRA-sensitivity in the test set. Test-set = 18 cell-lines. (D) The heatmap illustrates the expression levels of the ATRA-139 genes in the panel of 48 breast cancer cell-lines. Genes are clustered according to the Euclidean distance, while the cell-lines are ranked on the basis of the ATRA-scores. The training set (green) and test set (black) cell-lines are indicated on the right.

