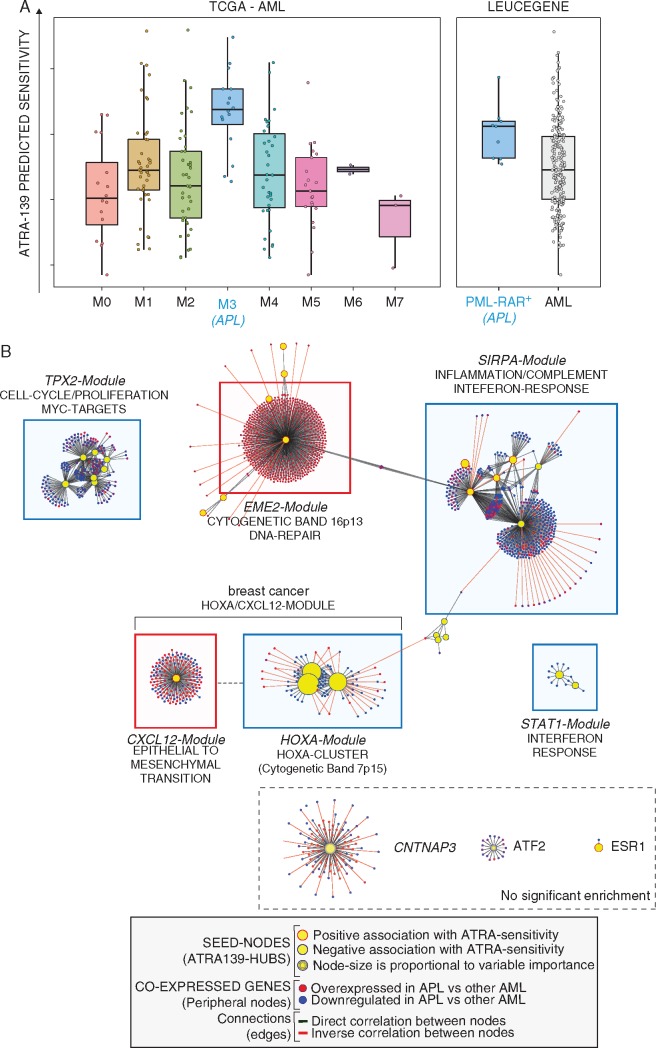
Figure 3.
ATRA-139 sensitivity predictions and co-expression network in AML patients. (A) Left: the panel illustrates ATRA-139 sensitivity predictions in the TCGA AML patients grouped according to the FAB-subtype. The M3-subtype (acute promyelocytic leukemia, APL) is highlighted in blue. All APL cases are characterized by expression of the PML-RAR gene. Right: sensitivity predictions in the Leucegene AML cases grouped according to the presence (PML-RAR+) absence (AML) of the PML-RAR gene fusion are shown. (B) The panel illustrates the co-expression network in AML. The identified network was obtained by applying the ARACNE algorithm to gene expression data and ATRA-139 genes were used as seed nodes (hubs) in the generation process. Modules of co-expressed genes significantly enriched for either known biological pathways or genomic regions are annotated and highlighted by colored boxes (predicted association to ATRA sensitivity: red, positive; blue, negative). Modules showing no enrichment are indicated by a dashed box (bottom right). Node colors indicate the expression ratio in APL relative to other AML subtypes (red, up-regulated; blue, down-regulated) and edge-colors indicate the correlation between adjacent genes (correlation: green, positive; red, negative). Further annotations are included in the provided legend (bottom).

