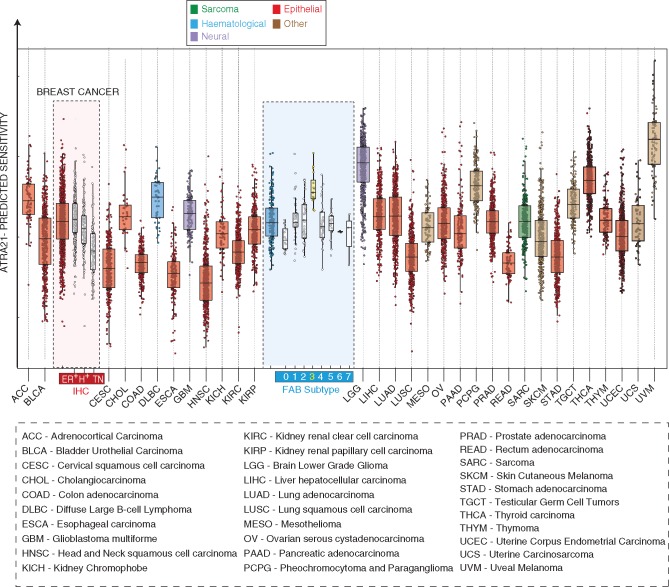
Figure 6.
ATRA-21 sensitivity predictions across tumor types. The box plots illustrate the distribution of ATRA-21 sensitivity predictions after grouping of the tumor types (TCGA database). In the case of breast cancer and acute myeloid leukemias, cases are stratified according to immuno-histochemical subtype and FAB classification, respectively. ER+, estrogen-receptor-positive; H+, HER2-positive; TN, triple-negative; 0–7, FAB-subtypes M0 to M7.

