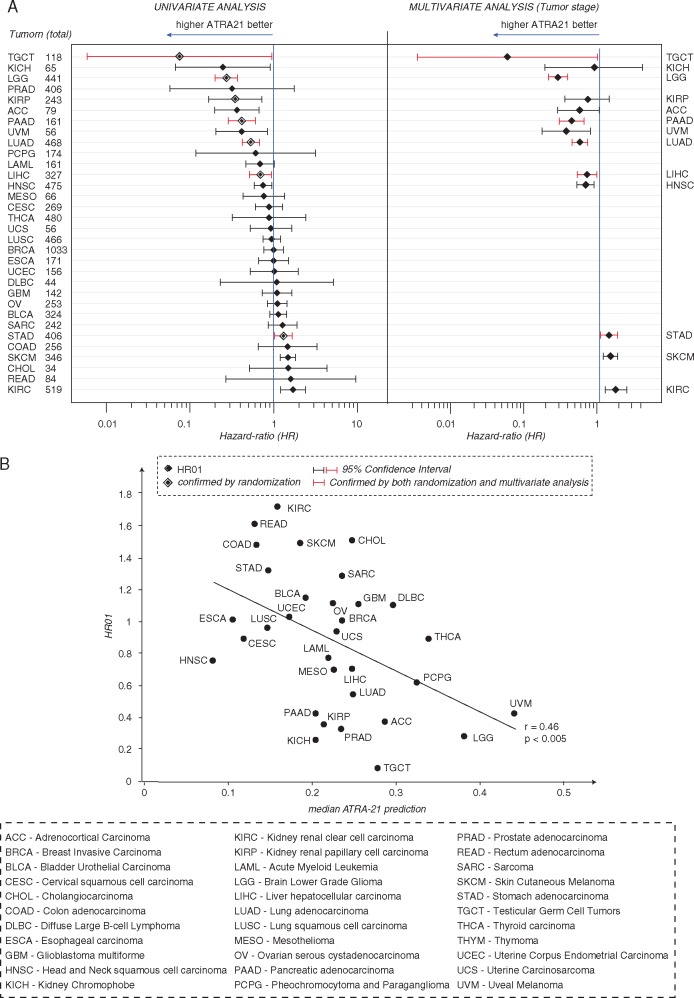
Figure 7.
Associations of ATRA-21 predictions with overall survival. (A) The Forest Plot shows the results of Cox proportional Hazard regression analysis (Left: univariate-analysis; right = multivariate analysis for tumor stage). Diamonds indicate the hazard-ratios associated with 0.1 unit increases in the ATRA-21 value for the different tumor types in the TCGA database. The 95% interval of confidence is represented by the horizontal bars. The vertical bar indicates no association. Larger diamonds indicate significant associations after randomization test. The tumor types marked in red are those for which significant association between ATRA-21 and overall survival is confirmed by randomization test and multivariate analysis. (B) The Scatter plot illustrates the correlation (r = Pearson’s correlation coefficient) between Hazard ratios and median ATRA-21 predictions in different tumor types. The asterisks indicate the tumor types showing significant associations after the randomization test. APL samples are not included in this analysis, since ATRA is used in the treatment of the disease.

