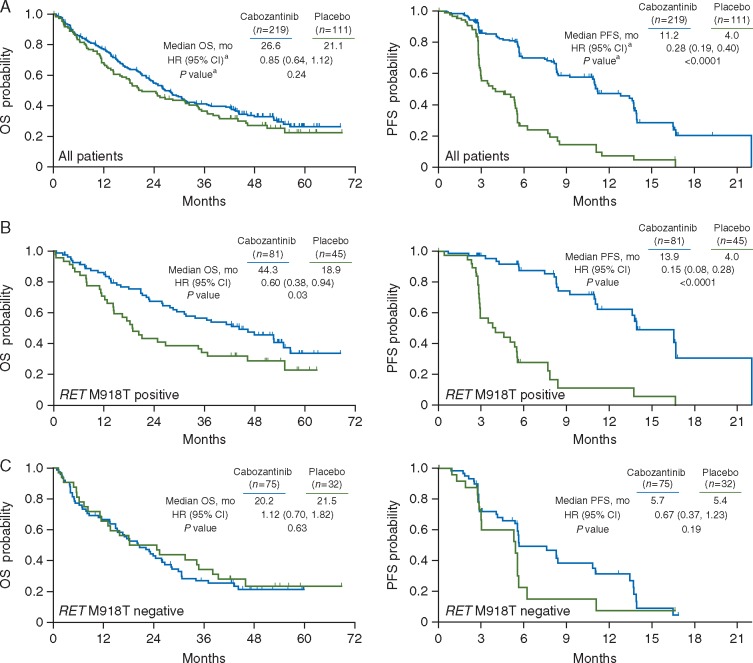
Figure 1.
Kaplan–Meier curve of overall survival (OS) and progression-free survival (PFS) in the (A) overall intent-to-treat population, (B) in patients with RET M918T–positive disease, and (C) in patients with RET M918T–negative disease. Data cut-off was 28 August 2014 for OS and 6 April 2011 for PFS. aAnalyses for (A) were stratified by randomization stratification factors, and analyses of subgroups (B and C) were unstratified. HR, hazard ratio; CI, confidence interval. P values were not adjusted for multiple comparisons. Methods for determining RET M918T status are described elsewhere [16].

