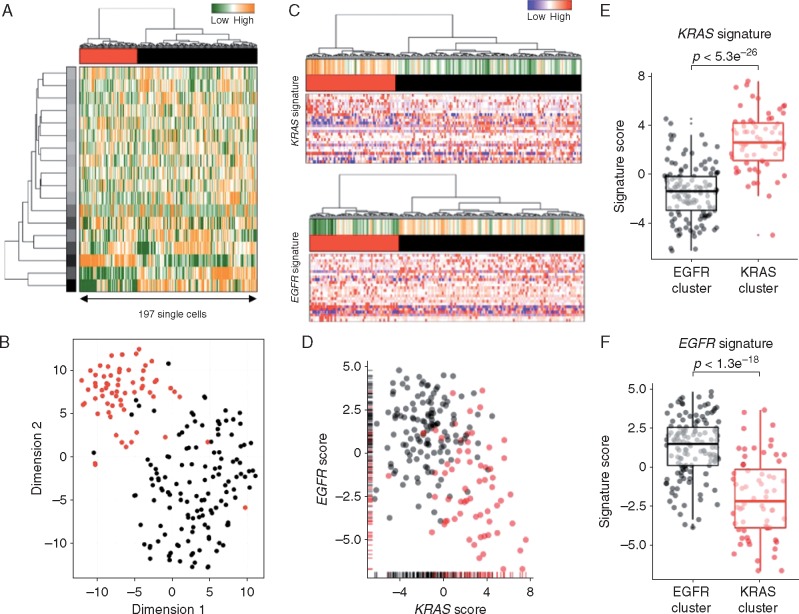
Figure 3.
Single-cell transcriptome profiles point to the presence of a KRAS-driven subclone. (A) Hierarchical clustering of 197 single cells (columns) derived from a capmatinib-resistant PDOX using the most variable gene sets [32]. Cells are grouped into two putative subclones (column labels) and correlating gene sets are summarized in aspects. Displayed are the most variable aspects (rows) and their importance (row colors). (B) Gene expression variances between cells displayed as t-distributed stochastic neighbor embedding (t-SNE) representation using previous defined distances and cluster identities (as in A). (C) Gene expression signatures derived from KRAS (upper panel) or EGFR (lower panel) mutant primary lung adenocarcinomas [27]. Gene expression levels of single cells are displayed as relative intensities [22]. Displayed are the 25 most variant genes and signatures are summarized in the panel above (orange: overrepresented; green: underrepresented). (D) Mutational signature intensities of single cells. Cells are separated by their signature expression levels for EGFR and KRAS mutations. Cells were assigned to clusters as in (A). Direct comparison of KRAS (E) or EGFR (F) signature scores between the putative subclones (KRAS: red; EGFR: black). Significant differences between groups (Student’s t-test) are indicated.

