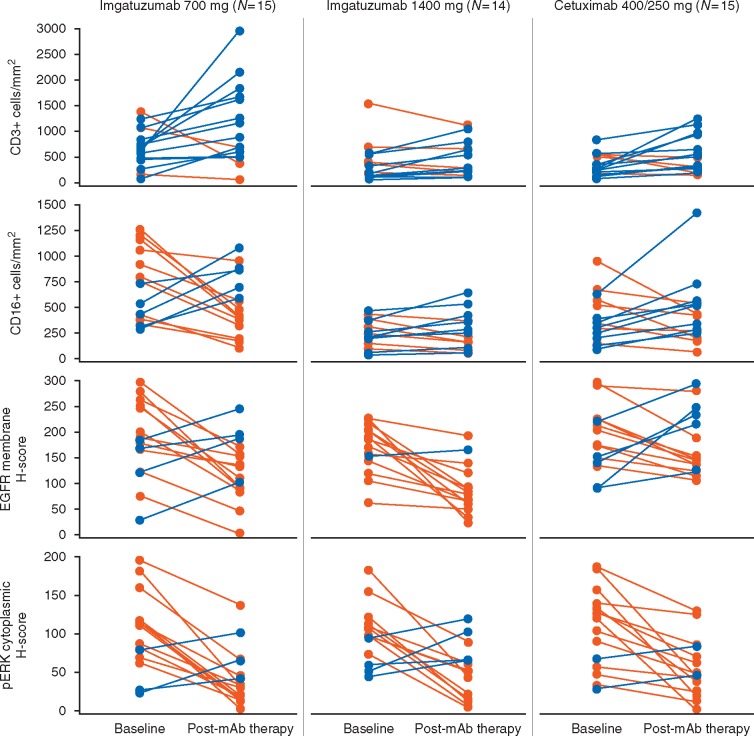
Figure 3.
Immunohistochemistry data showing the change in immune infiltration and EGFR/pERK staining following treatment. Multiple fields of view were assessed for each tumor biopsy. Immunostaining was scored as the median number of positively stained cells per mm2 for infiltrating CD3+ and CD16+ cells and using the H-score system [8] for EGFR and pERK immunohistochemistry. This scoring system combines the total percentage of cells staining with intensities of negative (0), weak (1), intermediate (2), and strong (3) to give a final value ranging from 0 to 300. Orange lines indicate patients in whom marker levels decreased after mAb treatment and blue lines indicate increases. Results show an on-treatment increase in immune infiltration with both antibodies and downregulation of EGFR and pERK. CD, cluster of differentiation; EGFR, epidermal growth factor receptor; mAb, monoclonal antibody; pERK, phosphorylated extracellular signal-regulated kinase.

