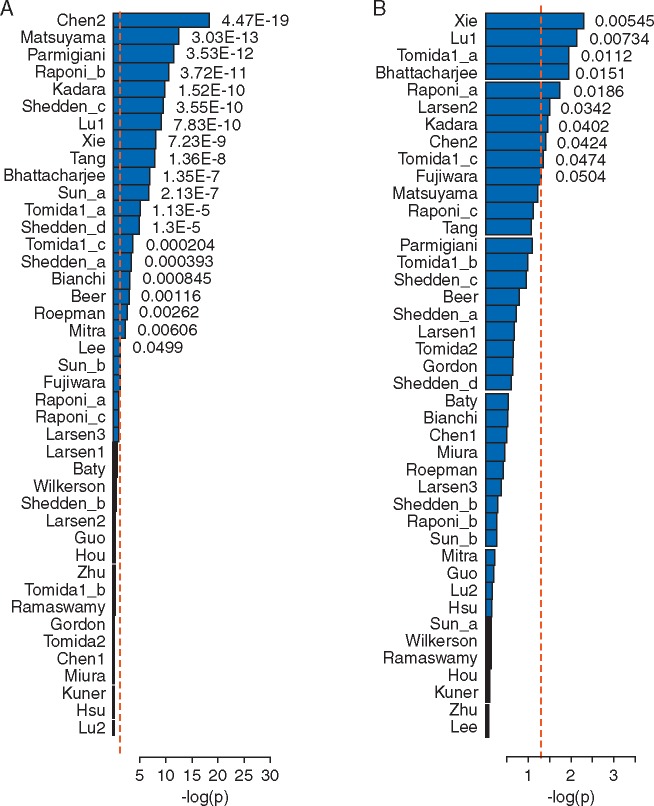
Figure 3.
Over 50% of published signatures perform better than random signatures when using SuperPCA prediction models (A) and 20% perform better when using PCA prediction models (B). The x-axis denotes the P-values comparing gene signatures against 100 random signatures, based on linear mixed-effect models. Red and black bars indicate signatures that carried out better or worse than random signatures, respectively.

