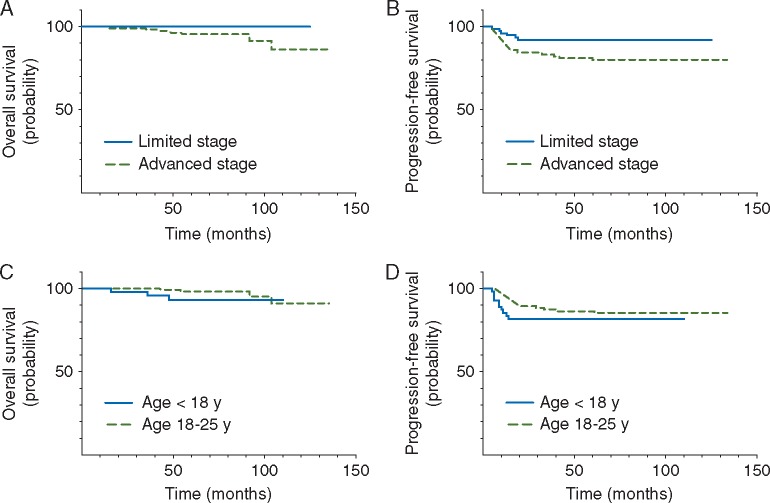
Figure 1.
Kaplan–Meier analysis of 5-year OS and PFS by the prognostic risk group and by the age. Patients with limited and advanced stage disease had 5-year OS 100% and 95% ± 2%, P=0.045, and PFS 92% ± 3% and 80% ± 4%, P = 0.03, respectively (A and B). OS and PFS for the paediatric (<18 year) and young adult (18–25 year) groups were 93% ± 4% versus 98% ± 1%, P=0.14, and 82% ± 5% and 86% ± 3%, P=0.33, respectively (C and D).

