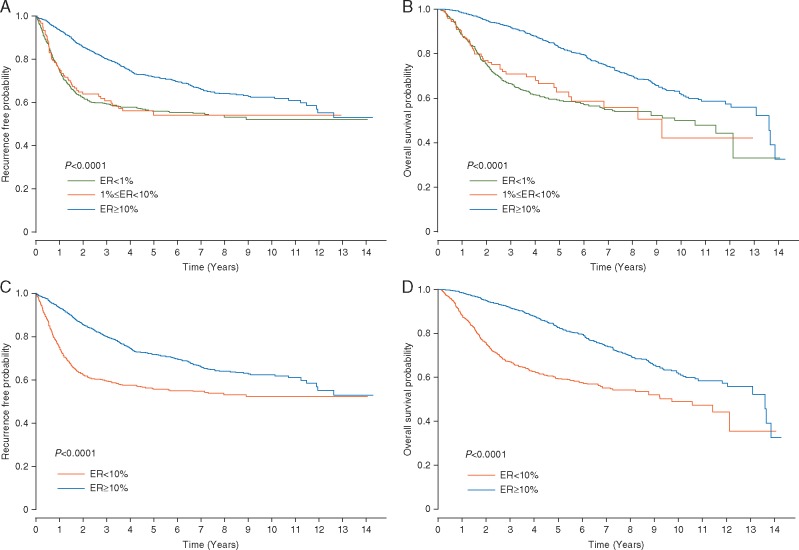
Figure 1.
Time to recurrence (TTR) and overall survival (OS) analysis. (A) TTR and (B) OS curves for patients with tumors with <1% of ER expression (ER < 1%), patients with tumors with ≥1% but <10% of ER expression (1% ≤ ER < 10%), and patients with tumors with ≥10% of ER expression (ER ≥ 10%). (C) TTR and (D) OS curves for patients with tumors with <10% of ER expression (ER < 10%) and patients with tumors with ≥10% of ER expression (ER ≥ 10%).

