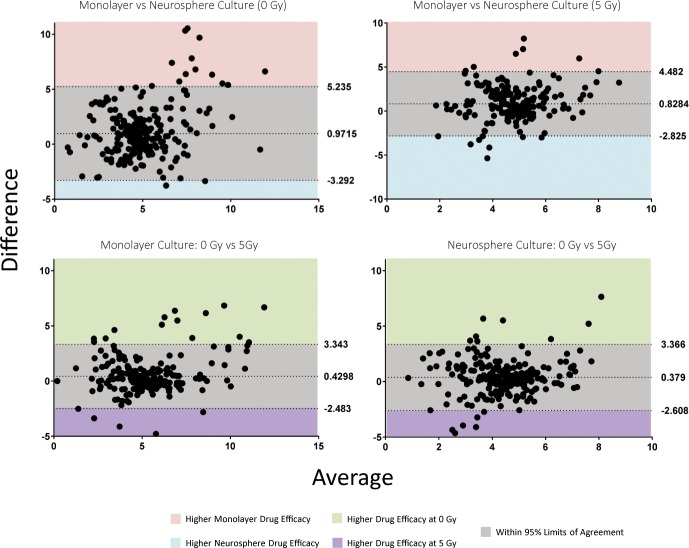
Fig 3. Bland-Altman method comparison of assay models demonstrated no overall bias for potency, whilst highlighting specific drugs to take forward for validation.
All pEC50s were stacked by patient-derived line. Mean difference and lower and upper limits of agreements (95% CI) are indicated by dotted lines. Values outside these limits can be considered real biological differences.

