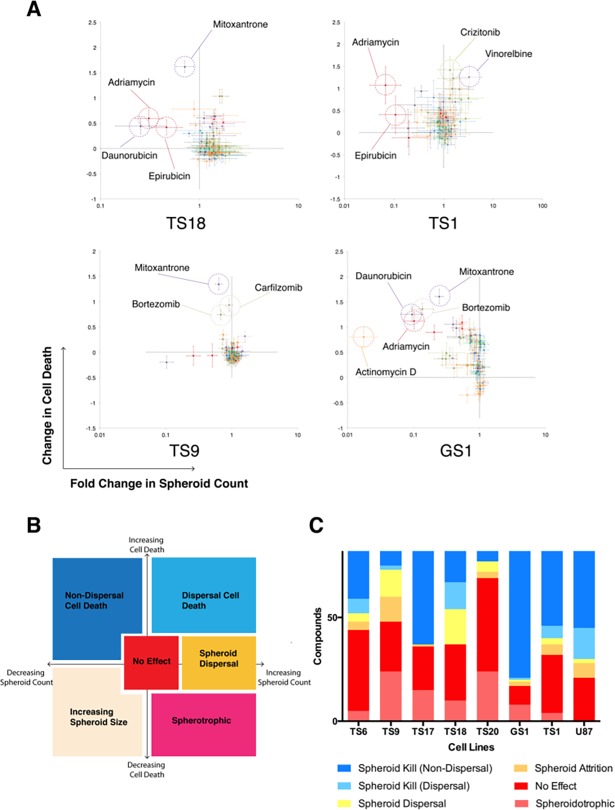
Fig 5. Response space analysis identifies highly effective drugs and patient cell–line resistance.
(A) Responses for TS1, TS18, TS9 and GS1 (0Gy) are depicted. Response is plotted onto a response space for each drug by the change in cell death (as measured by DRAQ7 intensity/spheroid cross sectional area), and fold change in neurosphere count. Highly responsive drugs are highlighted in dashed circles, with negative controls sitting at the intersection of the dotted lines (0, 1). (B) Sub -classification of drug response in neurosphere culture. Blue shaded areas represent responsive drugs, and yellow/orange/red areas represent resistance. (C) Summarized neurosphere response sub-classifications. The combined height of the yellow/orange/red columns provides an indication of the overall chemotherapeutic resistance of the cell line.

