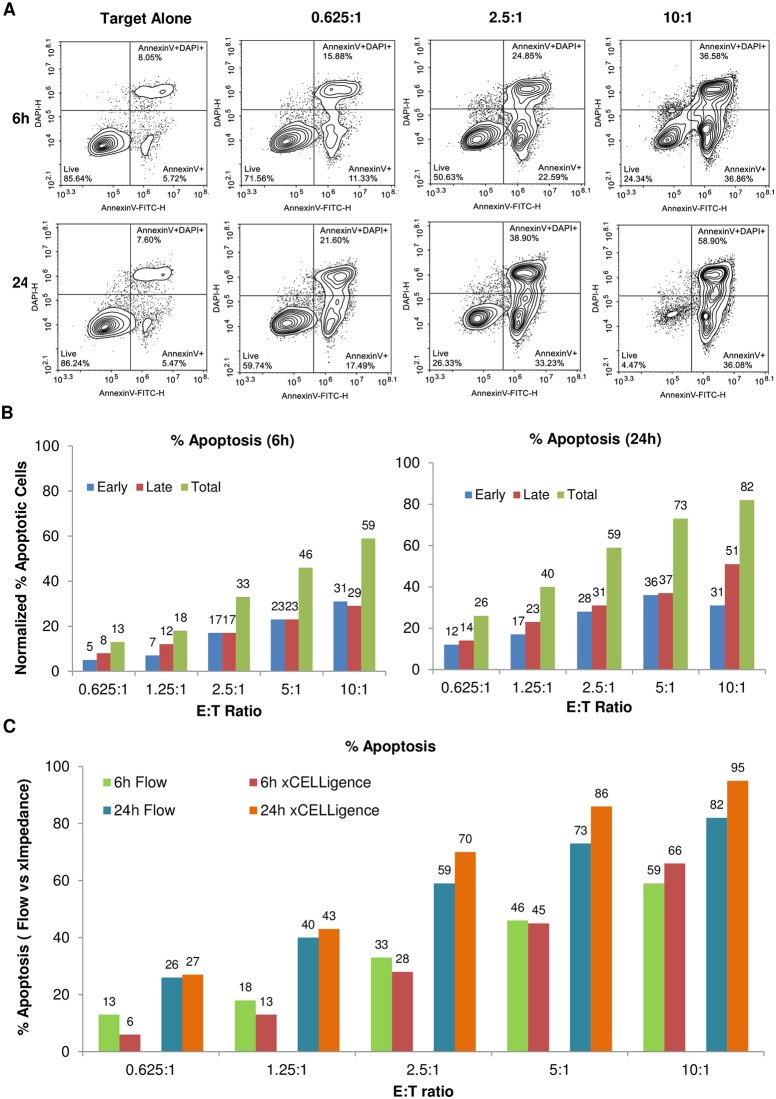
Fig 3. Correlation between % cytolysis determined through impedance measurement and flow cytometry.
(A) Replica plates for the same experiment in Fig 2 has been collected and analyzed by Flow Cytometry. Nuclear red-gated PC3s show ratio and time dependent increase of early apoptotic (annexin V+, DAPI-; bottom right of each plot), and late apoptotic (annexin V+, DAPI+; upper right of each plot) cells. (B) Charts show the % apoptotic cells for the flow data. (C) Total apoptosis measured by flow cytometry is similar to the results of impedance analysis.

